
This blog was written by summer intern Tad Dallas from the University of Georgia
During the summer of 2015, I participated in an internship program with Vertica. Most interns assisted in software development, but my primary goal was to use Vertica, Vertica Place, and Distributed R to address an ecological problem. This makes sense, since I am not a computer scientist, and even a bit unsure (though slightly less so now) about being called a ?data scientist?. In actuality, I am an ecology PhD student, studying the population dynamics of infectious disease. However, with access to Vertica’?s software and guidance, I was able to address an important ecological question that I had previously considered intractable due to the spatial scale.
I have long been interested in the idea of the parasite niche, and I thought that the global mapping of this niche could be interesting. The niche is defined as the range of environmental conditions that the species can persist in, typically defined in terms of things like climate variables. Specifically, this is the definition of the fundamental niche. Parasites are unique in that they commonly experience two distinct environments: external environment (i.e., climate), and the distribution and permissiveness (i.e., ability to be infected) of potential host species. To examine the influence of the climate and amphibian host community on the parasite niche, I examined a virulent pathogen of amphibians, a chytrid fungus hereafter referred to as Bd.
Global prediction is difficult, especially when dealing with a pathogen that has been sampled only approximately 8000 times across the entire globe. However, if we can understand the conditions where Bd has been found, we may be able to predict areas that are suitable for Bd, but currently have not been thoroughly sampled.
To investigate this, we trained boosted regression tree models on 80% of the available data, and predicted on the remaining 20% in order to determine accuracy. Our model had high accuracy when trained on twenty environmental variables (mainly related to temperature and precipitation), three human variables (road density, human population density, and an index based on light intensity as seen from space), and host community variables (amphibian species richness, and a measure of community composition). Environmental variables were found to be more important than amphibian host community variables, suggesting that this pathogen may be limited by climate, much like the distribution of a free-living animal, instead of being limited by the richness or composition of the host community.
So we have a trained model and global data that we obtained largely using Vertica and the Vertica Place geospatial add-on package. We can deploy our model to the Vertica database that contains the global data, and perform in-database scoring using the following vsql code:
CREATE TABLE preds AS (SELECT GbmPredict(altitude, Bio10, Bio11, Bio12, Bio13,

Bio14, Bio15, Bio16, Bio17, Bio18, Bio19, Bio1, Bio2, Bio3,

Bio4, Bio5, Bio6, Bio7, Bio8, Bio9, hostRichness, svd1, svd2, svd3, svd4, svd5, road, humans, lights

USING PARAMETERS model='the_deployed_model', ntrees = 50000, type = 'response') FROM covars);
The GbmPredict function, an in-development feature of Distributed R, is an R-UDF for in-database scoring of GBM models. Covariates include climate variables (with the Bio prefix), human variables (road, humans, lights), and amphibian host community variables (hostRichness and variables with the svd prefix). These svd variables correspond to the first five vectors of a singular value decomposition on the amphibian community composition at a given site.
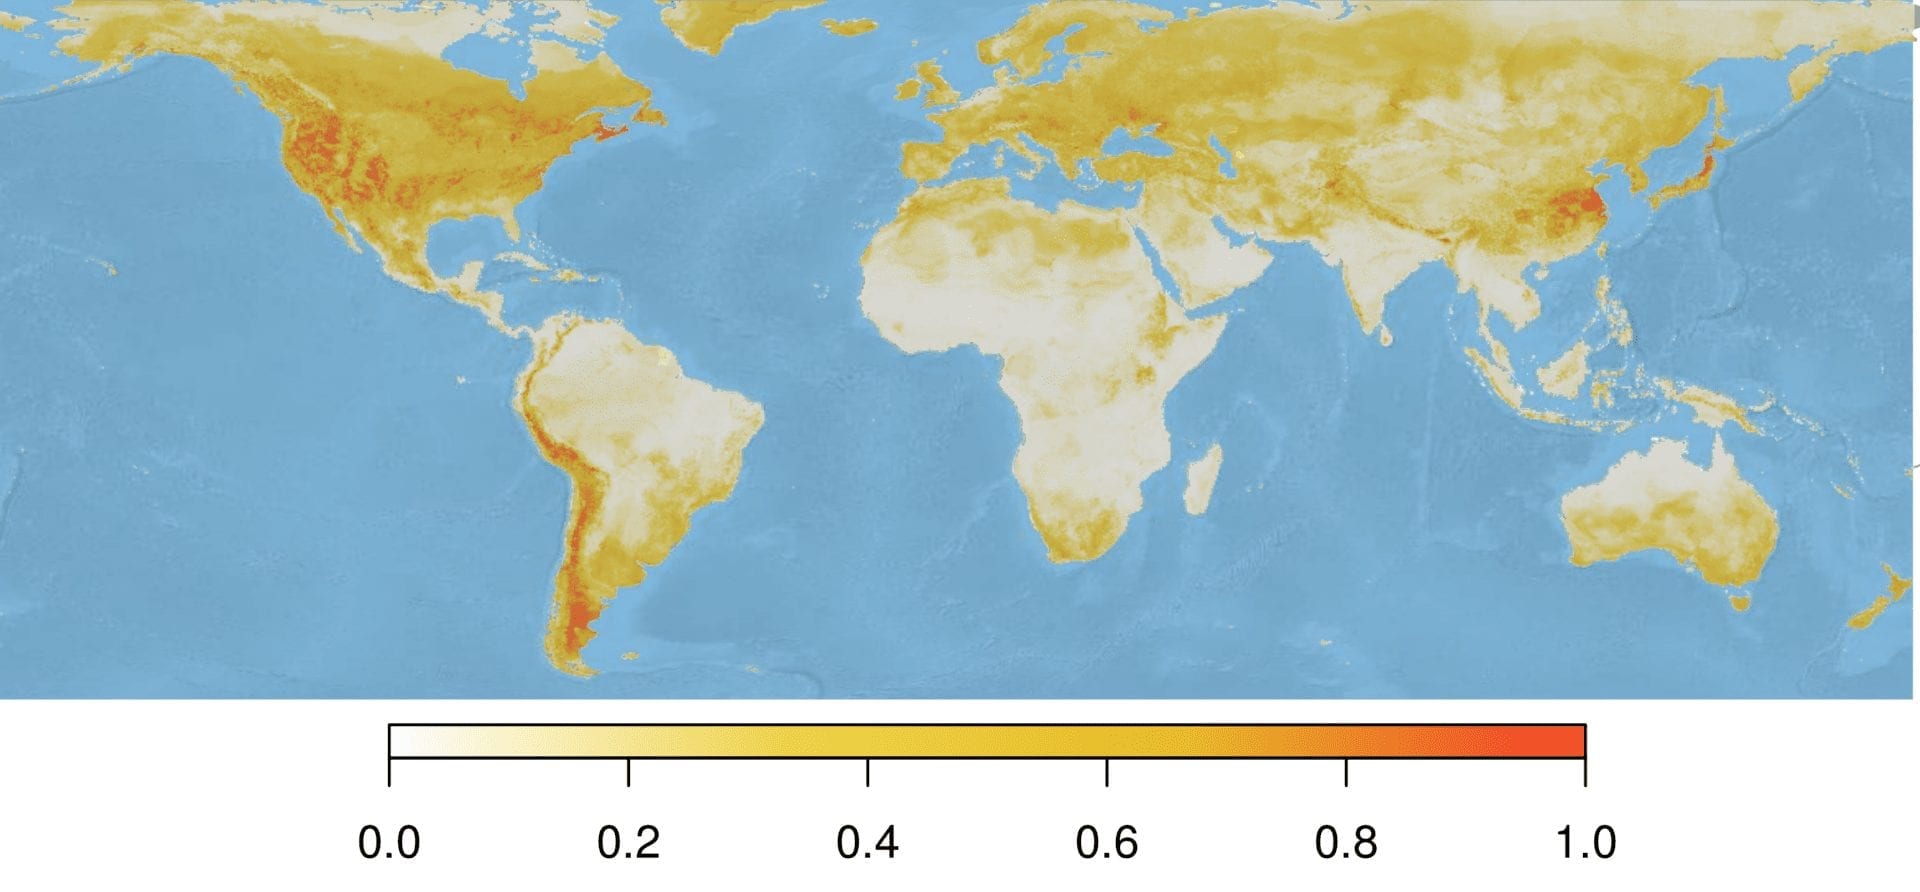
Our model provides a prediction for each spatial grid cell, which summed to approximately 31 million cells. The following map shows the model-predicted Bd suitability for the entire globe, or specifically the probability that Bd could be observed there given the environmental conditions present at that site.
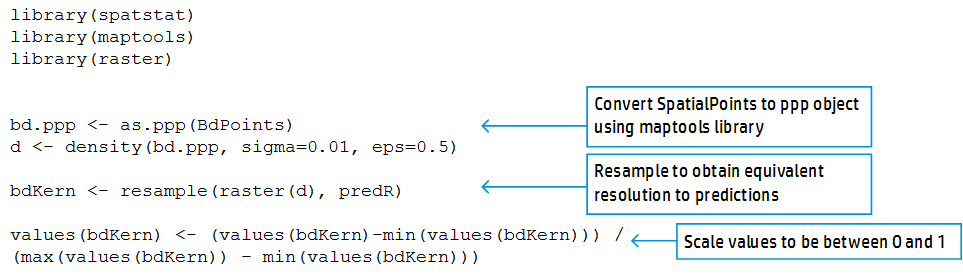
Next, we want to determine spatial sampling effort for each of those cells. To do this, we use the density function applied to a field of points determined using the maptools library, and data on our sampling sites in the form of a SpatialPoints object. Then, we resample this raster to make the sampling effort raster the same resolution as the predicted environmental suitability raster (called predR below). Finally, we scale the sampling effort raster to be between 0 and 1, with 1 corresponding to heavy sampled areas, and 0 to undersampled areas.
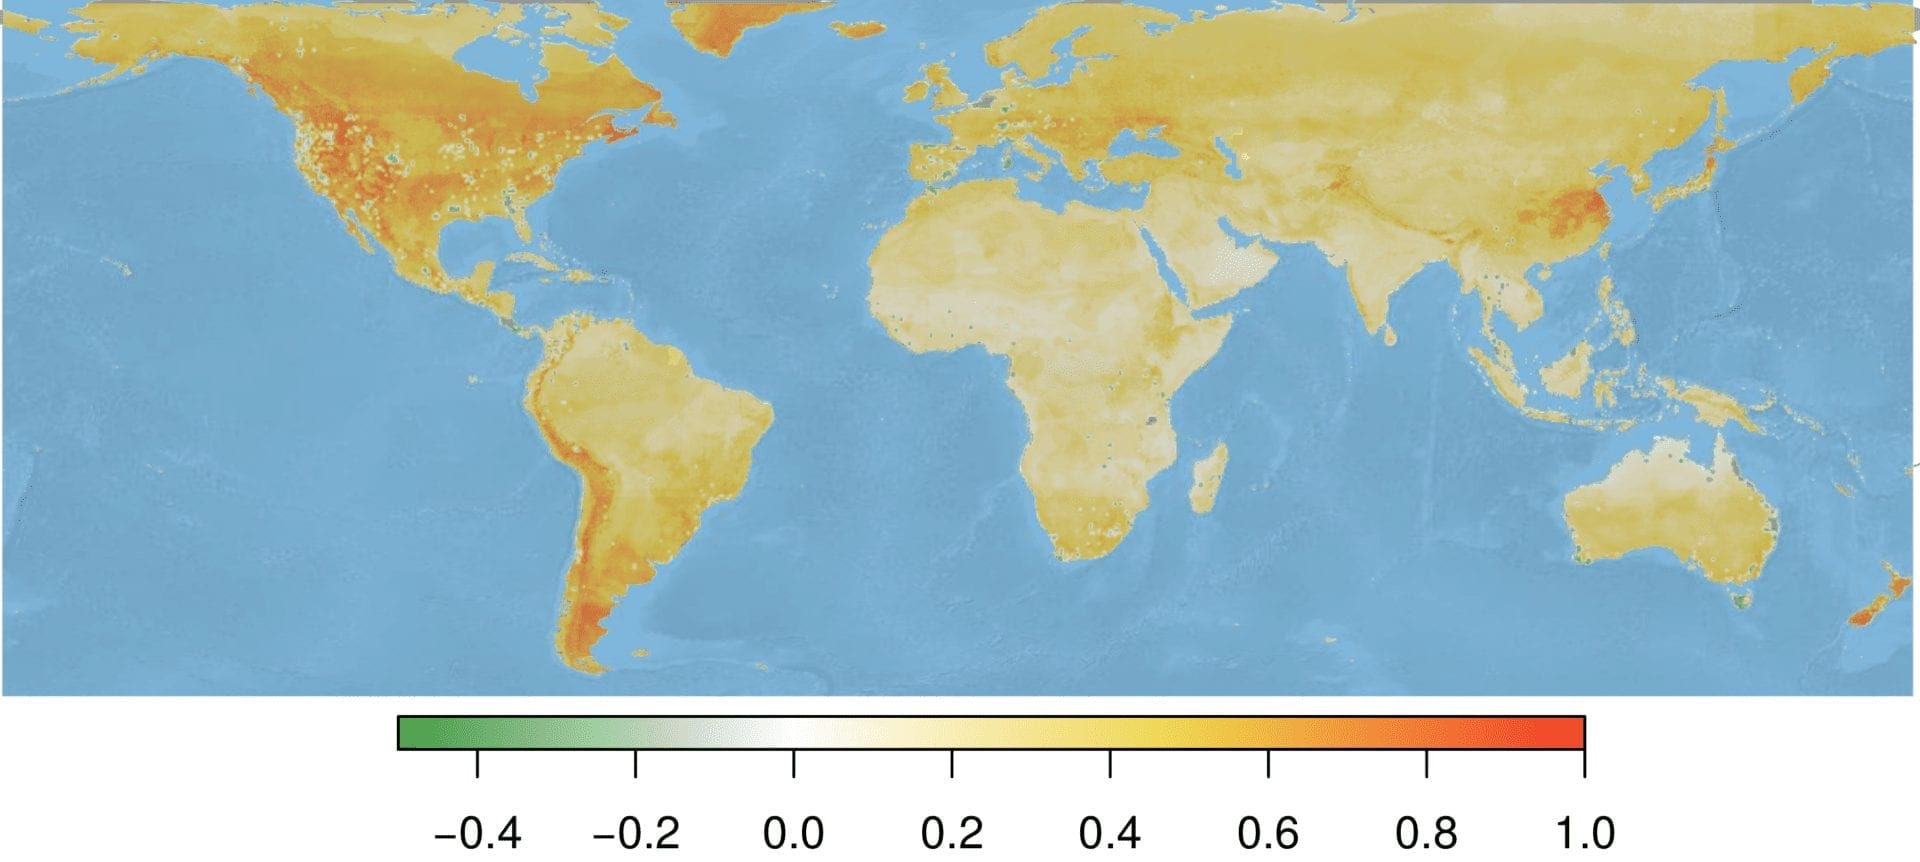
Standardizing our environmental suitability predictions by the sampling effort raster creates a map that identifies areas of high Bd suitability, but low sampling effort. This approach may permit targeted conservation and mitigation efforts. However, even incorporating information on sampling effort, areas known as hotspots for infection (e.g., Northwest United States) were still predicted as the most suitable areas. However, areas like New Zealand retained their importance, suggesting that this area is predicted to be suitable to Bd, and has not been sampled extensively.
Overall, this effort would not have been possible without Vertica and the Vertica Place geospatial add-on package for processing the large spatial data, and Distributed R and the vertica.dplyr package for handling distributed data objects within R. This work is currently being prepared for publication, and will help guide the use of our limited resources to investigate Bd presence in wild populations.
About the Author
Sarah Lemaire
Manager, Vertica Documentation