
Business Team Meeting Discussion Working Concept
Watch our short video about What’s New In MC in Vertica 8.1:
Read on to learn more!
Monitor Catalog Memory
With a new chart and alert capabilities, you can now use MC to monitor catalog memory.MC generates dashboard and email messages to alert you about the state of your system. MC 8.1 provides catalog growth alerts. You can set MC to alert you when the catalog memory on your nodes exceeds any memory limit you specify.
Your database’s Activity tab provides charts and visualizations to monitor the health of your database and cluster. The new Catalog Memory activity page displays the catalog memory for each node in your database using a line graph visualization. Use this page to check for sudden changes in catalog memory, or discrepancies in memory distribution across your nodes.

Configure Workload Analyzer Settings in MC
MC can automatically run Workload Analyzer (WLA) each day on the databases it monitors. WLA provides hints about optimizing database objects and tuning recommendations for sub-optimal queries. Because WLA can be resource-intensive, MC now provides more options for which databases you can run WLA on, and when.You can now set WLA to run at a different time for any or all databases that MC monitors. You can also set MC to never run WLA automatically. This setting is available on the Monitoring tab on the MC Settings page.
Increase JVM Heap Size via MC
In MC 8.1, you can configure application server JVM settings on the MC Settings page.By default, enabling Extended Monitoring in MC allows you to view more historical monitoring data—you can look back on several days or weeks’ worth of information about your system’s performance. For MC to handle larger amounts of monitoring data, Vertica recommends increasing JVM initial heap size and maximum heap size.
Configuring JVM settings wasn’t previously possible via the user interface, but with Vertica 8.1, you can now do so on the Configuration tab in MC settings.
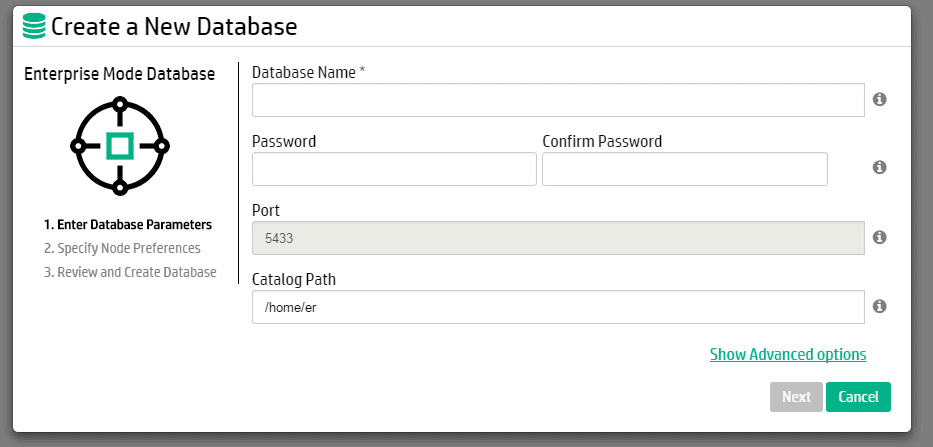
New Create Cluster Wizard
Vertica 8.1 enhances the look and feel of the wizards for creating new clusters and databases. This change also improves usability, making it easier to identify the cluster creation steps and required components.
For More Information
To find out more about Vertica Management Console, check out the Using Management Console section of the Vertica documentation.About the Author
Lisa Donaghue