


Monitoring Vertica
The purpose of this document is to help you monitor your Vertica database. The document is categorized into sections of query execution. You can use the queries in this document to investigate and troubleshoot database issues by monitoring the queries. This document describes queries and techniques for monitoring the following areas of your Vertica database:
- System health
- Resource usage
- Active sessions
- Active transactions
- Recovery
- Rebalance
- Historical activities
- Object statistics
- Query performance
- Monitor DC tables
System Health
Monitor the Node Status
In a Vertica database, a node in the DOWN state does not participate in any transactions committed after the time the node came down. It is imperative to monitor the status of your node to know which nodes are UP and running. Identify the state of each node using the following query:
=> SELECT node_name, node_state FROM nodes ORDER BY 1;
 node_name      | node_state
----------------+------------
v_demo_node0001 | UP
v_demo_node0002 | INITALIZING
v_demo_node0003 | UP
(3 rows)
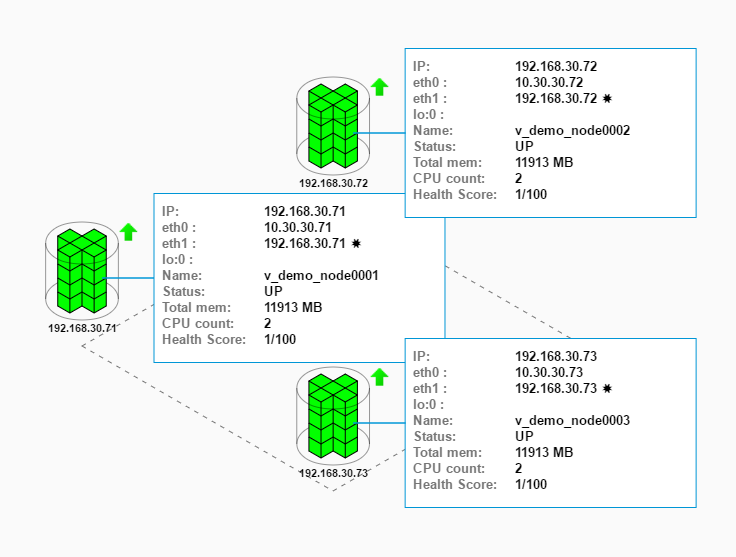
For a visual overview of all cluster nodes, use Management Console. Click the running database on the Databases and Clusters page and click the Manage tab at the bottom of the page to open the cluster status page. In Management Console, a visual representation similar to the following appears.
Examine the status of each of your node. If a node is DOWN, restart the node. To troubleshoot the issue, see the Database Node is DOWN checklist in the Vertica Knowledge Base. In the above example, all the nodes are UP. For more information about node recovery, see Node Recovery in Vertica in the Vertica Knowledge Base.
Monitor the Epoch Status
The AHM is a pointer to a specific time prior to which historical data can be purged from physical storage. Epoch status shows the advancement of the epochs and allows you to check if your cluster is healthy. View the epoch status using the following query:
=> SELECT current_epoch, ahm_epoch, last_good_epoch, designed_fault_tolerance, current_fault_tolerance, wos_used_bytes, ros_used_bytes FROM system;
  Current_epoch | ahm_epoch | last_good_epoch | designed_fault_tolerance | current_fault_tolerance | wos_used_bytes | ros_used_bytes
----------------+-----------+-----------------+--------------------------+-------------------------+----------------+----------------
           1176 |      1175 |            1175 |                        0 |                       0 |              0 |      310675364
(1 row)
Alternatively, you can also use the following query:
=> SELECT get_ahm_time(), get_ahm_epoch(), get_last_good_epoch(), get_current_epoch(), sysdate;
The epoch status tell you:
- Are designed_fault_tolerance and current_fault_tolerance the same?
- Is ahm_epoch close to last_good_epoch? If ahm_epoch is very far from last_good_epoch, the ancient history mark is not advancing.
- Is designed_fault_tolerance and current_fault_tolerance the same?
- What is the WOS/ROS usage?
The default AHM configuration is to move the AHM as close to the current time as possible. The AHM clears the delete vectors. If you notice the AHM time is more than 14 days ago, contact Vertica Technical Support.
Monitor the Delete Vector
Vertica creates delete vectors when an individual DELETE or UPDATE statement is run on a table. A high number of delete vectors adversely affects the performance of your database. Gather the total count of delete vectors for the system using the following queries:
=> SELECT COUNT(*) FROM v_monitor.delete_vectors;

				=> SELECT node_name, schema_name, projection_name, total_row_count, deleted_row_count, delete_vector_count FROM storage_containers WHERE deleted_row_count > total_row_count*.05::float ORDER BY deleted_row_count desc;

   node_name    | schema_name |    projection_name    | total_row_count | deleted_row_count | delete_vector_count
----------------+-------------+-----------------------+-----------------+-------------------+---------------------
v_demo_node0001 | public      | customer_dimension_b0 |           16906 |             16906 |                   1
v_demo_node0002 | public      | customer_dimension_b1 |           16906 |             16906 |                   1
v_demo_node0001 | public      | customer_dimension_b1 |           16654 |             16654 |                   1
v_demo_node0003 | public      | customer_dimension_b0 |           16654 |             16654 |                   1
...
A high number of delete vectors indicates the cluster is in a troubled state. To manage delete vectors, see Best Practices for Deleting Data in the Vertica Knowledge Base. Monitor the Number of ROS Containers Vertica has an upper threshold of 1024 ROS containers per projection. If the number of ROS containers in your database grows too large, it can negatively affect performance. For this reason, you should monitor the number of ROS containers. View the number of ROS containers per projection per node using the following query:
=> SELECT node_name, projection_schema, projection_name, SUM(ros_count) AS ros_count FROM v_monitor.projection_storage GROUP BY node_name, projection_schema, projection_name ORDER BY ros_count DESC;
   node_name     | projection_schema |       projection_name       | ros_count
-----------------+-------------------+-----------------------------+-----
v_vmart_node0001 | public            | t11_super                   | 3
v_vmart_node0001 | public            | tab3_super                  | 2
v_vmart_node0001 | public            | tab3_ukcol2                 | 2
v_vmart_node0001 | public            | shipping_dimension_super    | 1
v_vmart_node0001 | public            | small_input_impute_super    | 1
v_vmart_node0001 | store             | store_dimension_super       | 1
v_vmart_node0002 | public            | small_input_impute_super    | 1
v_vmart_node0002 | public            | shipping_dimension_super    | 1
v_vmart_node0001 | public            | small_input_impute1_super   | 1
v_vmart_node0001 | public            | vlog_super                  | 1
v_vmart_node0002 | public            | tab3_super                  | 1
v_vmart_node0002 | public            | visitsTemp_super            | 1
v_vmart_node0003 | public            | target_super                | 1
v_vmart_node0003 | public            | students_super              | 1
v_vmart_node0001 | public            | bar_super                   | 1
v_vmart_node0003 | public            | vendor_dimension_super      | 1
v_vmart_node0003 | public            | shipping_dimension_super    | 1
v_vmart_node0002 | public            | vlog_super                  | 1
v_vmart_node0003 | public            | mtcars_predict_svm_super    | 1
v_vmart_node0001 | online_sales      | call_center_dimension_super | 1
A high number (over 500) of ROS containers indicates a problem with the PARTITION BY clauses of your tables. It can also indicate that the merging process is not functioning. For more information, see Vertica Partitions: The FAQs in the Vertica Knowledge Base.
Resource Usage
Monitor the Resource Pools
Vertica provides built-in resource pools for executing queries. You can also create your own resource pools if your workload requires it. Resource pools allow Vertica to manage processor and memory resources. Check the status of resource pools using the following query:
=> SELECT sysdate AS current_time, node_name, pool_name, memory_inuse_kb,
general_memory_borrowed_kb, running_query_count FROM resource_pool_status
WHERE pool_name IN ('general') ORDER BY 1,2,3;

       current_time        |    node_name    | pool_name | memory_inuse_kb | general_memory_borrowed_kb | running_query_count
---------------------------+-----------------+-----------+-----------------+----------------------------+---------------------
2017-04-14 13:49:22.630529 | v_demo_node0001 | general   |         7132121 |                          0 |                   3
2017-04-14 13:49:22.630529 | v_demo_node0002 | general   |         7133456 |                          0 |                   3
2017-04-14 13:49:22.630529 | v_demo_node0003 | general   |         7133261 |                          0 |                   3
(3 rows)
Use the results to find out which node is slow and which queries are running or stopped. This query provides information about memory usage for each resource pool and the number of queries running on each resource pool. Monitor if a query is taking excessive memory resource and causing the cluster to slow down:
=> SELECT * FROM resource_acquisitions ORDER BY memory_inuse_kb desc limit X;
Monitor the Resource Pool Queue Status
You can check whether any transaction is queued by monitoring resource pools. Show all resource queues using the following query:
=> SELECT * FROM v_monitor.resource_queues;
   node_name    |  transaction_id   | statement_id | pool_name | memory_requested_kb | priority | position_in_queue |     queue_entry_timestamp
----------------+-------------------+--------------+-----------+---------------------+----------+-------------------+-------------------------------
v_demo_node0001 | 45035996273705862 |            1 | general   |             2374617 |        0 |                 1 | 2017-04-14 13:53:44.042381+09
v_demo_node0002 | 45035996273705862 |            1 | general   |             2375067 |        0 |                 1 | 2017-04-14 13:53:44.04009+09
v_demo_node0003 | 45035996273705862 |            1 | general   |             2374998 |        0 |                 1 | 2017-04-14 13:53:44.034676+09
(3 rows)
Resource queues provide information about requests pending for various resource pools.
Monitor the Resource Request Rejections
You can check resource request rejections using the following query:
=> SELECT * FROM v_monitor.resource_rejections;

   node_name     |      pool_id      | pool_name |           reason            | resource_type | rejection_count |   first_rejected_timestamp    |    last_rejected_timestamp    | last_rejected_value
-----------------+-------------------+-----------+-----------------------------+---------------+-----------------+-------------------------------+-------------------------------+----------------------
v_vmart_node0001 | 45035996273704996 | general   | Request exceeded high limit | Memory(KB)    |               1 | 2017-02-21 13:10:42.873417-05 | 2017-02-21 13:10:42.873417-05 |             3140435
v_vmart_node0002 | 45035996273704996 | general   | Request exceeded high limit | Memory(KB)    |               1 | 2017-02-21 13:10:42.873334-05 | 2017-02-21 13:10:42.873334-05 |             3111145
v_vmart_node0003 | 45035996273704996 | general   | Request exceeded high limit | Memory(KB)    |               1 | 2017-02-21 13:10:42.878341-05 | 2017-02-21 13:10:42.878341-05 |             3111143
Vertica monitors requests for resources that are rejected by the Resource Manager. Information is valid only as long as the node is up and the counters have been reset to 0 upon node restart. This information is useful for determining if there are resource space issues and which users/pools encounter problems. Monitor the System Resources Vertica provides system tables that let you monitor your database and track system resources bottlenecks.
=>  SELECT * FROM v_monitor.system_resource_usage ORDER BY end_time DESC;

   node_name     |      end_time       | average_memory_usage_percent | average_cpu_usage_percent | net_rx_kbytes_per_second | net_tx_kbytes_per_second | io_read_kbytes_per_second | io_written_kbytes_per_second
-----------------+---------------------+------------------------------+---------------------------+--------------------------+--------------------------+---------------------------+-------------------------------
v_vmart_node0001 | 2017-04-13 10:08:00 |                        23.97 |                      51.6 |                    72.89 |                      0.9 |                         0 |                        286.8
v_vmart_node0002 | 2017-04-13 10:08:00 |                         9.88 |                      0.84 |                    72.14 |                     0.26 |                         0 |                       255.47
v_vmart_node0003 | 2017-04-13 10:08:00 |                          9.7 |                      0.94 |                    72.14 |                     0.27 |                         0 |                          214
v_vmart_node0001 | 2017-04-13 10:07:00 |                        23.97 |                     51.81 |                   105.23 |                     0.84 |                         0 |                       272.06
v_vmart_node0002 | 2017-04-13 10:07:00 |                         9.88 |                       0.9 |                   104.42 |                     0.31 |                         0 |                       264.96
v_vmart_node0003 | 2017-04-13 10:07:00 |                         9.72 |                      0.95 |                   104.51 |                     0.22 |                         0 |                       267.63
v_vmart_node0001 | 2017-04-13 10:06:00 |                        23.97 |                     51.82 |                   101.15 |                     1.12 |                         0 |                       284.23
・・・
The system resource usage system table provides history about system resources, such as memory, CPU, network, disk, I/O. Monitor the Storage Space Vertica recommends that you have 40% free space for Vertica to run smoothly. Monitor storage space availability using the following query:
=>  SELECT * FROM v_monitor.storage_usage ORDER BY poll_timestamp DESC;

       poll_timestamp         |    node_name     | path |  device   | filesystem | used_bytes  | free_bytes  |      usage_percent
------------------------------+------------------+------+-----------+------------+-------------+-------------+-------------------------
2017-03-20 12:02:00.008656-04 | v_vmart_node0002 |      |           | vertica    | 10454126592 | 40141549568 | 20.66000000000000000000
2017-03-20 12:02:00.008653-04 | v_vmart_node0002 | /dev | devtmpfs  | devtmpfs   |      151552 |  1997717504 |  0.01000000000000000000
2017-03-20 12:02:00.008648-04 | v_vmart_node0002 | /    | /dev/sda2 | ext4       | 10454142976 | 40141533184 | 20.66000000000000000000
2017-03-20 12:02:00.00563-04  | v_vmart_node0001 |      |           | vertica    | 17218465792 | 33377210368 | 34.03000000000000000000
2017-03-20 12:02:00.005629-04 | v_vmart_node0001 | /dev | devtmpfs  | devtmpfs   |      151552 |  1997725696 |  0.01000000000000000000
The storage usage system table provides information about file system storage usage. This is useful for determining disk space usage trends.
Active Sessions
Monitor the Active Sessions
A user can connect to multiple running sessions at the same time. Multiple active user sessions can affect cluster performance. Using the following query, monitor sessions that are active at present:
=> SELECT user_name, session_id, current_statement, statement_start FROM v_monitor.sessions;
user_name |          session_id           |        current_statement                                                                  |         statement_start
----------+-------------------------------+-------------------------------------------------------------------------------------------+------------------------------
dbadmin   | v_vmart_node0001-73892:0x3b52 |                                                                                           | 2017-03-21 11:32:50.029212-04
dbadmin   | v_vmart_node0001-73892:0x5e78 | SELECT user_name, session_id, current_statement, statement_start FROM v_monitor.sessions; | 2017-03-21 16:22:19.145425-04
(2 rows)
The monitor sessions system table monitors external sessions. Use this table to:
- Identify users who are running long queries.
- Identify users who are holding locks because of an idle but uncommitted transaction.
- Determine which users to disconnect before you shut down the database.
- Determine the details of the database security used for a particular session, either Secure Socket Layer (SSL) or client authentication.
- Identify client-specific information, such as client version.
Close the Active Sessions
Closing a session interrupts the specified external session, rolls back the current transaction if any, and closes the socket. You can only close your own session. It might take some time before a session is closed.
=> SELECT close_session ('session id');

CLOSE_SESSION
--------------------------------------------------------------------
Session close command sent. Check v_monitor.sessions for progress.
(1 row)
A session id is a string that specifies which session to close. This identifier is unique within the cluster at any point in time but can be reused when the session closes.
Active Queries
Monitor the Running Queries
Query profiles provide information about executed queries. Use the following query to get a list of queries executing at the moment:
=> SELECT node_name, query, query_start, user_name, is_executing FROM v_monitor.query_profiles WHERE is_executing = 't';

   node_name     |                                                    query                                                    |          query_start          | user_name | is_executing
-----------------+-------------------------------------------------------------------------------------------------------------+-------------------------------+-----------+--------------
v_vmart_node0001 | SELECT node_name, query, query_start, user_name, is_executing FROM query_profiles WHERE is_executing = 't'; | 2017-04-18 10:54:47.976406-04 | dbadmin   | t
(1 row)
The result show the users (user_name) connected to the database and the queries (query) they are running. You can also see the query start time (query_start) and the place where (node_name) the query started running. The results help you understand the current workload of the cluster.
Monitor the Load Status
Check the loading progress of active and historical queries using the following query:
=> SELECT table_name, read_bytes, input_file_size_bytes, accepted_row_count, rejected_row_count, parse_complete_percent, sort_complete_percent FROM load_streams WHERE is_executing = 't' ORDER BY table_name;

   table_name    | read_bytes | input_file_size_bytes | accepted_row_count | rejected_row_count | parse_complete_percent | sort_complete_percent
-----------------+------------+-----------------------+--------------------+--------------------+------------------------+-----------------------
store_sales_fact |  375766803 |             375766803 |            5000000 |                  0 |                    100 |                     0
(1 row)
The results provide information about the active loading status. If you want to check the historical loading status, change the WHERE clause to WHERE is_executing = ‘f’.
Monitor the Lock Status
Vertica uses locks to manage data concurrency and consistency. Vertica automatically controls locking by limiting the actions a user can take on an object, depending on the state of that object. Vertica uses locks to monitor lock grants and requests for all nodes. A query with no results indicates that no locks are in use.
=> SELECT locks.lock_mode, locks.lock_scope, substr(locks.transaction_description, 1, 100) AS "left", locks.request_timestamp, locks.grant_timestamp FROM v_monitor.locks;

lock_mode | lock_scope  |                                                 left                                                 |       request_timestamp       |        grant_timestamp
----------+-------------+------------------------------------------------------------------------------------------------------+-------------------------------+------------------------------
I         | TRANSACTION | Txn: a0000000003082 'COPY store.Store_Sales_Fact FROM '/opt/vertica/examples/VMart_Schema/Store_Sale | 2017-03-17 18:47:46.462589+09 | 2017-03-17 18:47:46.462594+09
(1 row)
The locks system table provides information about the transactions that have active locks. This information helps analyze problems in the batch process and understand the reason for a slow-running query.
Recovery
Monitor the Node Recovery Status
In the Vertica database, a node in the DOWN state does not participate in any transactions committed since the time the node went down. After restarting the DOWN node, that node must recover the data it missed from the buddy nodes before moving to the UP state. When the node state is RECOVERING, track the progress of the node using the recovery status system tables.
=> SELECT node_name, recover_epoch, recovery_phase, current_completed, current_total, is_running FROM v_monitor.recovery_status ORDER BY 1;

   node_name     | recover_epoch | recovery_phase | current_completed | current_total | is_running
-----------------+---------------+----------------+-------------------+---------------+-----------
v_vmart_node0001 |               |                |                 0 |             0 | f
v_vmart_node0002 |               |                |                 0 |             0 | f
v_vmart_node0003 |               |                |                 0 |             0 | f
(3	rows)
The different statuses are:
- 1. is_running—the recovery is running
- 2. current_completed—the number of projections which completed to recovery
- 3. current_total—the number of projections which should be recovered
For more information see Node Recovery in Vertica in the Vertica Knowledge Base and the Node Recovery Checklist in the Vertica Troubleshooting Checklists.
Rebalance
Monitor the Rebalance Status
After you add or remove nodes in a Vertica cluster, Vertica redistributes the data among the nodes for optimal performance.
=> SELECT GET_NODE_DEPENDENCIES();

GET_NODE_DEPENDENCIES
--------------------------------------------------------------
Deps:
00011 - cnt: 13
00110 - cnt: 13
01100 - cnt: 13
11000 - cnt: 13
10001 - cnt: 13
11111 - cnt: 27
A clean node dependency lists (number of nodes + 1) lines. Each line shows the number of segmented projections. The last line specifies the number of replicated projections. In the binary form, each digit represents a node. For example, in the binary form 00011, where node 1 = 1, node 2 = 1, node 3 = 0, node 4 = 0, and node 5 = 0. 1 indicates that segments exist on the node and 0 indicates that segments do not exist on the node.
Monitor the Overall Progress of the Rebalance Operation
Monitor the progress of each currently executing rebalance operation, using the following query:
=> SELECT rebalance_method Rebalance_method, Status, COUNT(*) AS Count
FROM ( SELECT rebalance_method, CASE WHEN (separated_percent = 100 AND transferred_percent = 100) THEN 'Completed' WHEN ( separated_percent <>  0 and separated_percent <> 100) OR (transferred_percent <> 0 AND transferred_percent <> 100) THEN 'In Progress' ELSE 'Queued' END AS  Status FROM v_monitor.rebalance_projection_status WHERE is_latest) AS tab GROUP BY 1, 2 ORDER BY 1, 2;
Rebalance_method | Status      | Count
-----------------+-------------+-------
ELASTIC_CLUSTER  | Completed   | 8
ELASTIC_CLUSTER  | In Progress | 2
ELASTIC_CLUSTER  | Queued      | 2
REPLICATE        | Completed   | 50
(4 rows)
The query monitors the progress of each currently executing rebalance operation and returns:
- Method used to rebalance the current projection. Possible values are REFRESH, REPLICATE, and ELASTIC_CLUSTER
- Status of that method
- Number of projections
For more information about Rebalancing, see the Understanding Rebalancing, Part 2: Optimizing for Rebalancing in the Vertica Knowledge Base.
Historical Activities
Monitor the Queries Based on Execution Time
Check execution time of 10 queries and get detailed information about the slow queries.
=> SELECT user_name, start_timestamp, request_duration_ms, transaction_id, statement_id, substr(request, 0, 1000) as request FROM v_monitor.query_requests WHERE transaction_id > 0 ORDER BY request_duration_ms DESC limit 10;

user_name |        start_timestamp        | request_duration_ms |   transaction_id  | statement_id |                                request
----------+-------------------------------+---------------------+-------------------+--------------+---------------------------------------------------------------------
dbadmin   | 2017-03-30 12:33:56.381062-04 |             7567403 | 45035996274122533 |            1 | SELECT identifier, query FROM query_profiles;
dbadmin   | 2017-03-23 13:17:45.350174-04 |             6993612 | 45035996274068604 |            2 | select counter_name from execution_engine_profiles;
dbadmin   | 2017-03-13 13:17:12.618154-04 |             2195859 | 45035996273989990 |            2 | select * from customer_dimension;
dbadmin   | 2017-03-23 15:14:44.586491-04 |              988246 | 45035996274068604 |            4 | select * from execution_engine_profiles;
dbadmin   | 2017-04-13 10:08:21.999011-04 |              735847 | 45035996274232535 |           13 | SELECT * FROM v_monitor.system_resource_usage ORDER BY end_time DESC;
The query_requests system table returns information about user-issued query requests. The request_duration_ms column provides information about the length of time the query ran in milliseconds. Based on these results, you can identify the queries that take a long time to execute and target those slow queries to resolve troubleshooting issues.
Monitor the Memory Usage
In a Vertica database, some queries might use more memory while others might use less due to data volume or query complexity. Understand the memory usage for a particular query using the following query:
=> SELECT node_name, transaction_id, statement_id, user_name, start_timestamp, request_duration_ms, memory_acquired_mb, substr(request, 1, 100) AS request FROM v_monitor.query_requests WHERE transaction_id = transaction_id AND statement_id = statement_id;

node_name      |  transaction_id   | statement_id | user_name |        start_timestamp        | request_duration_ms | memory_acquired_mb |                                    request
----------------+-------------------+--------------+-----------+-------------------------------+---------------------+--------------------+-------------------------------------------------------------------------------
v_demo_node0001 | 45035996273715536 |            1 | dbadmin   | 2017-03-17 15:53:20.645486+09 |               19662 |            1838.12 | COPY mountains from '/home/dbadmin/data/flex/data.json' parser fjsonparser();
(1 row)
The results help you understand memory usage per query. Based on the results you can improve the query. You can change the table or projection design, or you can reduce data volume.
Object Statistics
Monitor the Partitions
Node partitions let you easily identify data you wish to drop, and they help reclaim disk space. You can specify partitioning for a table when you initially define the table with CREATE TABLE. Vertica automatically partitions data with each load operation. Alternatively, you can specify partitioning for an existing table by modifying its definition with ALTER TABLE. You must explicitly repartition existing data with the Vertica function PARTITION_TABLE. The default maximum for the ROS_COUNT field is 1024. View the partition count per node per projection using the following query:
=> SELECT node_name, projection_name, count(partition_key) FROM v_monitor.partitions GROUP BY node_name, projection_name ORDER BY node_name, projection_name;

   node_name    |       projection_name       | count
----------------+-----------------------------+-------
v_demo_node0001 | inventory_fact_partition_b0 |     5
v_demo_node0001 | inventory_fact_partition_b1 |     5
The results show the count of partitions. If the partitions are high in number for a projection, you can alter the metadata of an existing table using ALTER TABLE. For more information, see ALTER TABLE in the Vertica documentation and see Vertica Partitions: The FAQs in the Vertica Knowledge Base.
Monitor the Segmentation and Data Skew
Segmentation refers to organizing and distributing data across cluster nodes for fast data purges and query performance. Segmentation aims to distribute data evenly across multiple database nodes so all nodes participate in query execution. You specify segmentation with the CREATE PROJECTION statement's hash segmentation clause. However, the database can experience data skew. View the row count per segmented projection per node using the following query:
=> SELECT ps.node_name, ps.projection_schema, ps.projection_name, ps.row_count FROM v_monitor.projection_storage ps
INNER JOIN v_catalog.projections p ON ps.projection_schema = p.projection_schema AND ps.projection_name = p.projection_name WHERE p.is_segmented ORDER BY ps.projection_schema, ps.projection_name, ps.node_name;

 node_name      | projection_schema |  projection_name       | row_count
----------------+-------------------+------------------------+----------
v_demo_node0001 | online_sales      | online_sales_fact_b0   |   5001927
v_demo_node0002 | online_sales      | online_sales_fact_b0   |   4999302
v_demo_node0003 | online_sales      | online_sales_fact_b0   |   4998771
Use the above results to monitor data skew. The projections should have equivalent number of rows per projection per node. A large difference in the row count indicates data skew. You can minimize data skew by properly designing projections.
Performance
Monitor the Query Performance
When you submit a query to Vertica for processing, the Vertica query optimizer automatically chooses a set of operations to compute the requested result. These operations together are called a query plan. The choice of operations can drastically improve the run-time performance and resource consumption needed to compute the query results. Depending on the properties of the projections defined in your database, the query optimizer can choose faster and more efficient operations to compute the query results. As your database grows over time, queries can degrade in performance. It is important to monitor the performance of your queries—especially queries that are run frequently or access large data sets. The query_events system table returns information about query planning, optimization, and execution events. For more information about system tables, see System Tables for Query Performance in the Vertica Knowledge Base.
Monitor the Load Streams
The load_streams system table contains data about active and historical load metrics for load streams. This is useful for obtaining statistics about how many records got loaded and rejected from the previous load. Vertica maintains system table metrics until they reach a designated size quota (in kilobytes). This quota is set through internal processes, which you cannot set or view directly. View the performance of load streams using the following query:
=> SELECT schema_name, table_name, load_start, load_duration_ms, is_executing, parse_complete_percent, sort_complete_percent, accepted_row_count, rejected_row_count FROM v_monitor.load_streams;

schema_name  |    table_name     |          load_start           | load_duration_ms | is_executing | parse_complete_percent | sort_complete_percent | accepted_row_count  | rejected_row_count
-------------+-------------------+-------------------------------+------------------+--------------+------------------------+-----------------------+---------------------+------------------
myschema     | table01           | 2017-02-13 15:48:49.983308-05 |         9283     | f            |                        |                   100 |      4              |                  0
public       | fruits            | 2017-02-21 14:01:51.549974-05 |         343115   | f            |                        |                   100 |    4                |                  0
store        | store_orders_fact | 2017-02-06 10:55:24.073555-05 |         1513     | f            |                    100 |                   100 |      300000         |                  0
myschema     | table01           | 2017-02-14 14:16:39.336496-05 |         7711     | f            |                        |                   100 |      3              |                  0
public       | casey1            | 2017-03-16 14:48:46.446581-04 |         15419    | f            |                        |                   100 |     3               |                  0
online_sales | online_sales_fact | 2017-02-06 10:55:25.634915-05 |         17401    | f            |                    100 |                   100 |     5000000         |                  0
myschema     | table01           | 2017-02-13 11:57:05.532119-05 |         15973    | f            |                        |                   100 |     5               |                  0
The load_streams system table shows the total number of rows that were loaded or rejected. Grouping this information by source can help you determine from where data is coming from.
Data Collector Tables
Data Collector is a utility that collects and retains database monitoring information.
| Category | Component name | DC table name | Description |
| Query | RequestsIssued | dc_requests_issued | History of all SQL requests issued |
| RequestsCompleted | dc_requests_completed | History of all SQL requests completed | |
| ExecutionEngineProfiles | dc_execution_engine_profiles | History of EE profiles | |
| QueryExecutions | dc_query_executions | Various query execution steps | |
| Resource | ResourceAcquisitions | dc_resource_acquisitions | History of all resource acquisitions |
| ResourcePoolStatus | dc_resource_pool_status | Resource Pool status information | |
| Event | OptimizerEvents | dc_optimizer_events | History of important events during optimizer planning |
| ExecutionEngineEvents | dc_execution_engine_events | History of important events during local planning and execution | |
| Session | SessionStarts | dc_session_starts | Sessions started |
| SessionEnds | dc_session_ends | Sessions ended | |
| Lock | LockAttempts | dc_lock_attempts | History of lock attempts (resolved requests) |
| LockReleases | dc_lock_releases | History of lock releases |
See the System Tables for Analyzing Query Performance for a comprehensive list of system tables in the Vertica Knowledge Base.

