


Technical Exploration: Permabit Albireo Virtual Data Optimizer
The Goal of this Technical Exploration
Vertica engineers performed this exploration to determine how architecturally transparent Permabit's Virtual Data Optimizer (VDO) is in a typical small Vertica implementation, and to report any observations about how the VDO could be best integrated into a Vertica environment.
This project was not an exploration of the VDO de-dupe or compression capabilities. In addition, this project should not be construed as qualification testing of Vertica using LVM (logical volume management) volumes, which are a base requirement of VDO. Vertica does not officially support LVM volumes, but it is on the roadmap for future releases.
The results are summarized later in this document in Summary of the Results.
Permabit Overview
Albireo Virtual Data Optimizer (VDO) is a block virtualization technology that creates de-duplicated pools of block storage. De-duplication is a technique for reducing the consumption of storage resources by eliminating multiple copies of duplicate blocks. Instead of writing the same data more than once, each duplicate block is detected and recorded as a reference to the original block. Albireo VDO maintains a mapping from logical block addresses (used by the storage layer above VDO) to physical block addresses (used by the storage layer under VDO). After de-duplication, multiple logical block addresses may be mapped to the same physical block address; these are called shared blocks. Block sharing is invisible to users of the storage, who read and write blocks as they would if VDO were not present. When a shared block is overwritten, a new physical block is allocated for storing the new block data to ensure that other logical block addresses that are mapped to the shared physical block are not modified.
Albireo VDO provides inline, block-level compression as a separately licensed feature. Compression is a data reduction technique that works well with file formats that do not necessarily exhibit block-level redundancy, such as log files and databases.
For more information on Permabit's VDO, go to A look at VDO, the new Linux compression layer.
Test Environment
The hardware Verticachose for this testing was bare metal, typical for a small Vertica implementation. It should be noted that this configuration was not necessarily optimal for VDO performance, e.g., SCSI versus SSD drives were used. Because the main focus of testing was stability and the ability to recover from a failure, this configuration was fine.
We executed performance tests as the foundation for the stability and recovery tests. The execution time results were captured using a standard ext4 file system and a VDO ext4 file system. This was purely an out-of-the-box, side-by-side comparison to check for any major deviations from performance timing differences that should be noted. No tuning or optimization was done to try to impact results.
Hardware
All testing was performed using HP ProLiant DL360 Gen9 hosts with the following specs:
- Genuine Intel Intel(R) Xeon(R) CPU E5-2690 v3 @ 2.60GHz CPU mhz:1200.000 cache size:30720KB bogomips:5193.46
- Processor Chips: 2 Cores Per CPU:12 hyperthreads:2 TotalVirtualCPUs:48
- MemTotal:264.4GB SwapTotal:2GB
- HP 759548-001 HP G8 G9 600-GB 12G 15K 2.5 SAS SC disks, total of 8 drives providing 4TB storage running in RAID 5
CPU frequency scaling was disabled as recommended by both Vertica and VDO documentation.
File System Configuration
The device /dev/sdb was partitioned into two standard formatted ext4 partitions at ~900 GB each, and under an LVM volume group, two VDO formatted ext4 partitions at ~1 TB each.
The resulting df output for the partitions looked like this:
[root@partg9-005 ~]# df -k
Filesystem 1K-blocks Used Available Use% Mounted on
...
/dev/sdb2 1007245124 75208 955998104 1% /data1
/dev/sdb3 912708596 176916 866162068 1% /data2
/dev/mapper/vdo_vol1 1320986612 71768 1253805980 1% /vdo1
/dev/mapper/vdo_vol2 1320986612 71768 1253805980 1% /vdo2
/dev/mapper/vdotest_vol_group-vdo_vol1--index
5160576 146884 4751548 3% /mnt/dedupe-index-vdo_vol1
/dev/mapper/vdotest_vol_group-vdo_vol2--index
5160576 146884 4751548 3% /mnt/dedupe-index-vdo_vol2
Note in the output above that the two index volumes were created automatically when VDO formatted the respective partition. There are the VDO indexes used to track references to de-duped blocks.
We set the IO Scheduler for the sdb device to deadline as required by Vertica and VDO documentation.
The VDO partitions were formatted with:
writePolicyset to synchronous (the default) to ensure that writes are committed and minimize loss in the event of an unexpected outage.vdoLogicalSizeset to 1.25 of thevdoPhysicalSizebased on the VDO analysis tool showing < 25% de-dupe/compression expected.- VDO volume creation was passed the following parameters based on Permabit Support recommendations:
--vdoPhysicalSize=1T --vdoLogicalSize=1.25T
--albireoMem=0.25
--vdoSlabSize=2G --writePolicy=sync
--vdoReadCache=enabled --vdoReadCacheSize=20M --blockMapCacheSize=1.25G
Vertica Database
The Vertica database created for this project was a 3-node cluster with K-safety=1 (additional copies of data with node offset 1). We performed all pre-install system user and operating system configuration requirements. The database installation ran smoothly without warnings or failures. (One exception was the warning about LVM being active.)
We used all the out-of-the-box Vertica configuration and resource manager settings. We did not perform any performance tuning. The CATALOG file system was standard ext4 for all tests. We set the DATA,TEMP file system to the first of two standard ext4 file systems (/data1) for standard ext4 tests, and to the first of two VDO ext4 file systems (/vdo1) for the VDO tests.
tpcds_data=> select node_name,storage_path,storage_usage from disk_storage;
node_name | storage_path | storage_usage
-----------------------+--------------------------------------------------------------------+---------------
v_tpcds_data_node0001 | /catalog/vcatalog/tpcds_data/v_tpcds_data_node0001_catalog/Catalog | CATALOG
v_tpcds_data_node0001 | /data1/vdata1/tpcds_data/v_tpcds_data_node0001_data | DATA,TEMP
v_tpcds_data_node0002 | /catalog/vcatalog/tpcds_data/v_tpcds_data_node0002_catalog/Catalog | CATALOG
v_tpcds_data_node0002 | /data1/vdata1/tpcds_data/v_tpcds_data_node0002_data | DATA,TEMP
v_tpcds_data_node0003 | /catalog/vcatalog/tpcds_data/v_tpcds_data_node0003_catalog/Catalog | CATALOG
v_tpcds_data_node0003 | /data1/vdata1/tpcds_data/v_tpcds_data_node0003_data | DATA,TEMP
(6 rows)
tpcds_vdo=> select node_name,storage_path,storage_usage from disk_storage;
node_name | storage_path | storage_usage
----------------------+------------------------------------------------------------------+---------------
v_tpcds_vdo_node0001 | /catalog/vcatalog/tpcds_vdo/v_tpcds_vdo_node0001_catalog/Catalog | CATALOG
v_tpcds_vdo_node0001 | /vdo1/vdata1/tpcds_vdo/v_tpcds_vdo_node0001_data | DATA,TEMP
v_tpcds_vdo_node0002 | /catalog/vcatalog/tpcds_vdo/v_tpcds_vdo_node0002_catalog/Catalog | CATALOG
v_tpcds_vdo_node0002 | /vdo1/vdata1/tpcds_vdo/v_tpcds_vdo_node0002_data | DATA,TEMP
v_tpcds_vdo_node0003 | /catalog/vcatalog/tpcds_vdo/v_tpcds_vdo_node0003_catalog/Catalog | CATALOG
v_tpcds_vdo_node0003 | /vdo1/vdata1/tpcds_vdo/v_tpcds_vdo_node0003_data | DATA,TEMP
(6 rows)
Test Suite
We performed the testing using a copy of the TPC_DS standardized test suite, configured for a Vertica environment. We configured the TPC_DS test suite for generating, loading, and querying data in a Vertica database. Configuration settings changed for this research were:
• Folders where we stored the generated data and queries (either on the standard ext4 or VDO ext4 file systems)
• Size of the generated data
• Number of concurrent users executing queries
• Number of load threads
• Number of concurrent loads
#Folder to store the generated data
dataPath="/data2 or vdo2/tpc_ds/tpcds-source"
#Folder to store the generated queries
queriesPath="/data2 or vdo2/tpc_ds/tpcds-queries"
# Number of GB to be generated
size=850
# Number of users for the test
#users="10 20 30"
users="1 5 10 15 20 25"
repetitions=1
#Number of processes per host to generate data.
loadThreads=24
#Path to copy the tests scripts and TPC_DS folder
tpcdsFolder="$HOME/tpcds_vertica"
#Number of concurrent loads per node
concurrentLoads=10
The test suite provides for, and was configured for, the following:
- Data generation—Generating random data for all tables with raw size ranging from 100 GB to 750 GB.
- Data load—Loading data from the generated .dat text files. Load threads was set to 24 (half # virtual CPUs) and concurrent loads was set to 10.
- Query generation—Generating 99 queries of varying complexity to be executed by the specified number of users a specified number of repeated times.
- Query execution—Running the 99 queries for the set number of concurrent users ranging from 1 to 25, in increments of 5.
- Reports—Gathering timing and resource data used in the generation of result reports. The only manipulation done here was to disable the Vertica scrutinize step because it added significant time to each test run and ultimately was not used in analyzing the test results.
Recovery tests included:
- Taking node0003 down gracefully using admintools, deleting all files under the data file system, doing a recovery from scratch, and confirming successful recovery and data consistency.
- Taking node0003 down using the HP server's iLo interface to force an immediate host power off during an intense load (simulating a power outage), and then powering the node back on, allowing recovery, and confirming successful recovery and data consistency.
Performance tests included:
- Generate data, load data, generate queries, and run 5 concurrent user queries. Show the timing differences and if those timing differences were linear.
- Static data loaded, generate queries, and run an increasing number of concurrent user queries. Show the timing differences and if the timing differences were linear.
Additional data captured included:
- Reviewing the footprint of the 750 GB test data set source and loaded database data files at Linux, vdoStats, and Vertica levels.
Test Notes
We performed all tests using standard ext4 file systems for TPC_DS test files and Vertica database data storage location. The tests were performed again using VDO ext4 file systems for those same items.
Between each test run, we cleared the Linux and Vertica caches as follows:
$ echo 3 >/proc/sys/vm/drop_caches
$ vsql -A -w '$vertica$' -c "select clear_caches();"
The VDO Evaluation Guide recommends recreating VDO volumes between tests. This was time consuming. We ran tests recreating and not recreating the VDO volumes between tests. The result were similar.
Test Results
Recovery Tests
In the recovery from scratch test, the third node in the database was taken down gracefully halfway through a parallel load. We deleted the data files in the data storage location. We brought the down node back up and monitored it for proper recovery and data consistency.
| Data FS Type | Crash Type | Recovery Successful? | Notes |
|---|---|---|---|
| ext4 | LoseDataDir | Yes | After recovery, data that was loaded up to the point of node halt was consistent. |
| VDO | LoseDataDir | Yes | After recovery, data that was loaded up to the point of node halt was consistent. |
In the recovery from iLo force power off test, the third node was abruptly taken down using HP's iLo interface and sending it a force power off. This step emulated a power failure, with no chance to do graceful logical process shutdowns. The down node was brought back up using iLo Power On and monitored for proper recovery and data consistency.
| Data FS Type | Crash Type | Recovery Successful? | Notes |
|---|---|---|---|
| ext4 | iLo | Yes | After recovery, data that was loaded up to the point of node halt was consistent. |
| VDO | VDO | Yes | After recovery, data that was loaded up to the point of node halt was consistent. |
In the recovery from scratch and the recovery from iLo force power off tests, there was no need to rebuild the VDO index. Everything seemed good after normal restart and recovery.
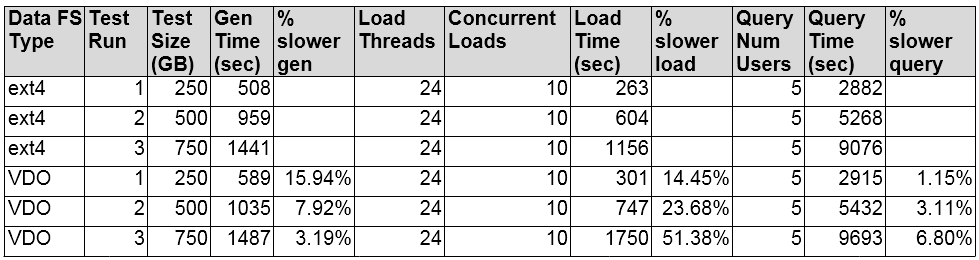
Generate, Load, and Five Concurrent User Query Tests
In the generate, load, and five concurrent users tests, we increased the size of the test data each run, starting at 250 GB and ending at 750 GB. This was basically to see if increasing the data size impacted performance significantly in the VDO environment. Data generation and query times were fairly consistent between file system types. As the size increased, VDO seemed to introduce some performance lag. Additional tests were run and the load time differences varied depending on size and concurrent users. For more information, see the summary of this document.
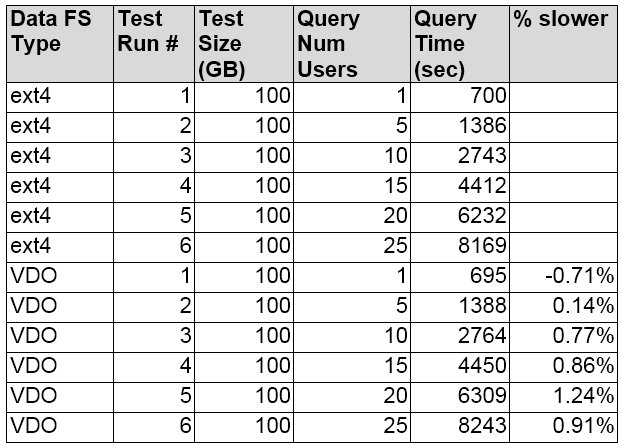
Static Data Loaded, Generate Queries, and Run Increasing Number of Concurrent User Queries Tests
The purpose of the static data loaded, generate queries, run increasing numbers of concurrent users test was to see if this would increase the number of files opened and read. We wanted to see if that increase would impact performance significantly. It did not. As the number of users increased, there was minimal deviation in query time.
Footprint Info Captured
The footprint data was captured after the 750 GB loads in both the standard ext4 database and VDO ext4 database. Minimal differences were expected because the albscan tool reported an anticipated 3% savings.
- Standard ext4
/data1contained the database storage container files for data, and/data2contained the generated queries and source data files that we loaded. - VDO ext4
/vdo1contained the database storage container files for data, and/vdo2contained the generated queries and source data files that were loaded.
We used the df command to determine the amount of free space on all file systems, in kilobytes:
[dbadmin@partg9-004 ~]$ df -k
Filesystem 1K-blocks Used Available Use% Mounted on
...
/dev/sdb2 1007245124 196456840 759616472 21% /data1
/dev/sdb3 912708596 230539092 635799892 27% /data2
/dev/mapper/vdotest_vol_group-vdo_vol1--index
5160576 4542212 356220 93% /mnt/dedupe-index-vdo_vol1
/dev/mapper/vdotest_vol_group-vdo_vol2--index
5160576 4542212 356220 93% /mnt/dedupe-index-vdo_vol2
/dev/mapper/vdo_vol1 1320986612 196454824 1057422924 16% /vdo1
/dev/mapper/vdo_vol2 1320986612 230537268 1023340480 19% /vdo2
We used the du command to determine the disk usage in the Vertica data storage directories:
[dbadmin@partg9-004 ~]$ du -b --max-depth=1 /data1/vdata1/tpcds_data
201092244549 /data1/vdata1/tpcds_data/v_tpcds_data_node0001_data
[dbadmin@partg9-004 ~]$ du -b --max-depth=1 /vdo1/vdata1/tpcds_vdo
201092243589 /vdo1/vdata1/tpcds_vdo/v_tpcds_vdo_node0001_data
OS level du of TPC_DS load source file dirs
[dbadmin@partg9-004 ~]$ du --max-depth=1 /data2/tpc_ds/tpcds-source
230400832 /data2/tpc_ds/tpcds-source
[dbadmin@partg9-004 ~]$ du --max-depth=1 /vdo2/tpc_ds/tpcds-source
230400832 /vdo2/tpc_ds/tpcds-source
Review the VDO utility report of the Vertica data storage volume (vol1) and the TPC_DS load source data volume (vol2):
[dbadmin@partg9-004 ~]$ sudo vdo-5.2.1.74/bin/vdoStats --human-readable --si /dev/mapper/vdo_vol1
Device Size Used Available Use% Space saving%
/dev/mapper/vdo_vol1 1.1T 202.7G 896.9G 18% 11%
[dbadmin@partg9-004 ~]$ sudo vdo-5.2.1.74/bin/vdoStats --human-readable --si /dev/mapper/vdo_vol2
Device Size Used Available Use% Space saving%
/dev/mapper/vdo_vol2 1.1T 240.0G 821.9G 22% 8%
In Vertica, look at the PROJECTION_STORAGE system table to review the space usage and number of ROS containers for standard ext4:
tpcds_data=> SELECT node_name, SUM(used_bytes) usedbytes, SUM(ros_used_bytes) rosbytes, SUM(ros_count) roscount FROM PROJECTION_STORAGE GROUP BY node_name ORDER BY node_name;
node_name | usedbytes | rosbytes | roscount
-----------------------+--------------+--------------+----------
v_tpcds_data_node0001 | 200553101330 | 200553101330 |       89
v_tpcds_data_node0002 | 200556649788 | 200556649788 | 89
v_tpcds_data_node0003 | 200556319255 | 200556319255 | 88
(3 rows)
Now look at the same information for VDO ext4:
tpcds_vdo=> SELECT node_name,SUM(used_bytes) usedbytes, SUM(ros_used_bytes) rosbytes, SUM(ros_count) roscount FROM PROJECTION_STORAGE GROUP BY node_name ORDER BY node_name;
node_name | usedbytes | rosbytes | roscount
----------------------+--------------+--------------+----------
v_tpcds_vdo_node0001 | 200553100370 | 200553100370 | 89
v_tpcds_vdo_node0002 | 200556649691 | 200556649691 | 88
v_tpcds_vdo_node0003 | 200556318934 | 200556318934 | 89
(3 rows)
Summary of the Results
The focus of this technical exploration was to test VDO's transparency in a Vertica environment. We ran several days of constant resource-intensive tests. We also ran specific tests that simulated system and Vertica failures. We did not observe any abnormal results. The file systems remained responsive and stable throughout. Other than the installation check for LVM, the VDO service and file system were transparent to Vertica.
There was minimal performance impact for small data sets under high-concurrency query situations, but increased performance impact as the size of data sets increased. We determined that the results varied based on many tuning factors and Vertica data characteristics. Some Linux level operations showed performance impact, and changes such as discard/nodiscard on mount and a VDO max_discard_sectors had some impact on the results. So the observed performance impact was not a Vertica specific behavior.
We did not attempt a full optimization because it was outside the scope of this exploration. In a production environment, system administrators should optimize Vertica and VDO for the particulars of that implementation.
There didn't seem to be any huge space savings. The vdoStats for the 750 GB run showed 11% savings on blocks used, which was better than the 3% reported by the VDO analysis tool. Results may vary depending on many tuning factors and on the Vertica design and data.
We used the Vertica vioperf utility to see if disk I/O throughput met Vertica requirements. We found that vioperf doesn't run on the VDO volumes unless the VDO volume creation sets the 512 compatibility mode.
As of this testing (January 2017), Vertica does not support the VDO base requirement of LVM. Until LVM is fully qualified, we do not recommend using LVM in a production environment.
Keep reading to find out how we conducted the tests of Permabit with Albireo VDO.
Recommendations
As a result of our testing, we recommend the following:
- Permabit's VDO has LVM2 as a base requirement. As of January, 2017), Vertica does not currently support the use of LVM. The Vertica server installer checks for active LVM file systems and posts an alert if it finds any. You can either install Vertica prior to activating LVM and installing VDO, or you can use the -
-failure-threshold=NONEargument toinstall_vertica, bypassing the warning, assuming that you have resolved all other issues it may have reported. - Engage Permabit for help with requirements, sizing, setup, configuration, and finetuning, especially when working through the best practices for indexing, caching, and
writePolicyoptions for synch or asynch.
- The VDO analysis tool reports anticipated space savings from de-duplication and compression. This tool can be used when calculating your VDO volume create parameter values. If you set the logicalsize to a value greater than the physicalsize, increase the
blockMapCacheSizeby an equal amount. We recommend 1 GB of memory per 1 TB of logical space. For example, if you increase logicalsize by 25%, you should also increaseblockMapCacheSizeby 25%:--vdoPhysicalSize=1T--vdoLogicalSize=1.25T--blockMapCacheSize=1.25G
- Our test volumes used the following parameters:
--vdoPhysicalSize=1T--albireoMem=0.25--vdoSlabSize=2G--writePolicy=sync--vdoReadCache=enabled--vdoReadCacheSize=20M--blockMapCacheSize=1.25G
The default for the discard/nodiscard option for ext4 in RHEL 6 is nodiscard. The VDO file system for this exploration was mounted with discard to ensure that unused blocks were discarded on file deletion. The discard option causes VDO to unmap the discarded blocks and quickly reclaim unused physical space on the VDO volume. There are benefits and drawbacks to discard and nodiscard, so review these results if implementing with Vertica.
If the VDO install complains that there are no header files in the build or source directories, try one of the following:
- Force the install of the kernel headers for your RHEL version using this command:
$ sudo yum install "kernel-devel-uname-r == $(uname -r)"
or
- Install the following packages for your version of the kernel:
kernel-debug-devel.x86_64kernel-headers.x86_64
Make sure to follow the steps to set the VDO volumes up for remount on a host reboot. Otherwise, any Vertica resources you've configured to use the volumes will not find them and will generate a variety of errors.
A Vertica user might assume that if the database is running K-safety=1 and there are duplicate copies of the data, they can gain great de-duplication savings. However, this is not the case. Currently, the VDO process only de-dupes and compresses on the host it is running on. There are no cluster-spanning capabilities.
If run against a VDO volume, the Vertica vioperf I/O benchmark tool for disk throughput fails with Error creating aligned memory. By default, VDO volumes are formatted using 4k blocks. vioperf expects 512-byte blocks. So you can't use vioperf on a default VDO 4k block volume. There is a compatibility mode that you can enable at VDO volume create time that makes it 512 bytes, but there may be a performance impact. We did not test that.
It's important to continually monitor the free space on the file system mounted on the VDO volume. If the volume runs out of blocks, it goes into a forced read-only mode. This mode may present challenges. For example, if you haven't prepared LVM and VDO to allow adding storage, and you run out of blocks and go into read-only mode, Vertica stops and will not restart until you add more space. Preparation to allow volume growth and monitoring usage are critical to uninterrupted use of the file system.

