


Spread Debugging
What is Spread?
Vertica uses an open source toolkit, Spread, to provide a high-performance messaging service that is resilient to network failures. Spread daemons start automatically when your database starts up for the first time. The spread daemons run on control nodes in your cluster. The control nodes manage message communication.
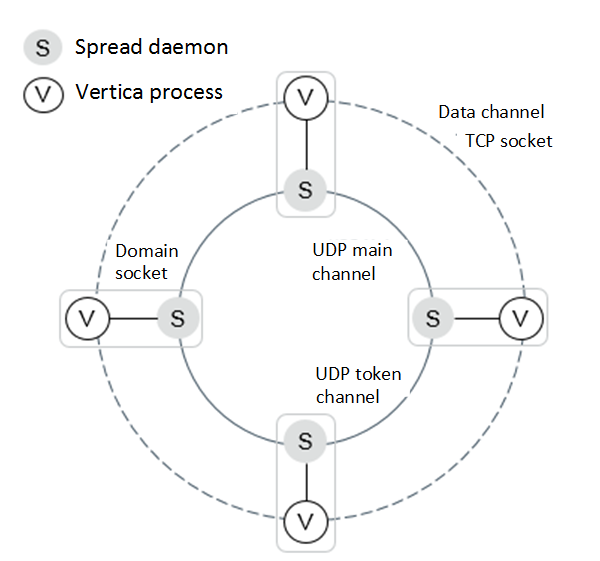
Vertica Process and Spread Daemons Pairs
The Vertica installation procedure installs Spread daemons on your database. A node in the Vertica process communicates with Spread daemons using domain socket. Between the nodes, communication is through 2 channels—the data channel and the control channel (UDP main channel and UDP token channel). The following image shows a 4-node cluster with a domain socket and 2 channels.
- Vertica process and Spread daemon on the same node connect to each other through the domain socket.
- Vertica process on one node connects with Vertica process on another node through the TCP socket.
- Spread daemon on one node connects to the Spread daemon on another node through the UDP token and main channelss.
How Vertica and Spread Work Together
If all the nodes are healthy, Vertica and Spread communicate seamlessly with each other.
Spread daemons communicate with one another by exchanging UDP packets. The two UDP channels (or ports) used are:
- The main channel—where Spread daemons sends Spread-related control messages to other daemons, and Vertica-related control messages originated from the Vertica servers.
- A token channel—where a special message called a Spread token is passed from one Spread daemon to the next Spread daemon. The token is important for membership, fault tolerance, and for enforcing consistent control message ordering.
If Spread on one node stops communicating with the other Spreads in the cluster, the Spread daemon removes that node from the cluster membership. The Spread daemon waits for a specific time called Spread Token Timeout before removing nodes from the membership.
Spread on a node communicates with the Vertica process on that node through a Domain socket and sends a heartbeat to check its health. If the heartbeat is missed more than 5 times, Spread daemon on that node evicts the Vertica process and notifies all other nodes through the UDP socket
When Vertica and Spread Cannot Communicate
You may encounter situations when the communication between the Spread daemon and Vertica fails.
Spread Token Timeout
The Spread daemons monitor each other's health using a token mechanism. The token is a special Spread message passed from one node to another node in the current active membership using the User Datagram Protocol (UDP). The token verifies that the Spread daemons in all the nodes are active. The token is active for a specific time called Spread Token Timeout. If the user kills a Spread daemon, the Spread daemons on the other nodes in the cluster detect the killed Spread daemon through a token timeout.
The default Spread Token Timeout in Vertica 9.1 and earlier is 8 seconds. In Vertica 9.2 and later, the default Spread Token Timeout depends on the number of configured Spread segments. If the number of configured Spread segments is 1, the default timeout is 8 seconds. If it is more than 1, the default timeout is 25 seconds. If network delays or temporary pauses of a Virtual Environment last longer than the spread timeout period, you may see UP nodes leave the database. In these cases, you can increase the spread timeout to reduce or eliminate instances where UP nodes leave the database.
In Azure, you may see nodes that are running leave the database due to scheduled maintenance. Azure's maintenance downtime is usually well-defined. For example, Azure's memory-preserving updates can pause a VM for up to 30 seconds while performing maintenance on the system hosting the VM. This pause does not disrupt the node. It continues normal operation once Azure resumes it. If you deploy your Vertica cluster using Azure Marketplace, the spread timeout defaults to 35 seconds. If you manually create your cluster in Azure, the spread timeout defaults to 8 or 25 seconds, as described earlier.
The long token timeout needs more time until Spread recognizes the DOWN node and to remove the nodes from the cluster.
For more information about how to adjust Spread Token Timeout, see Adjusting Spread Daemon Timeouts For Virtual Environments.
For more information about the cause of the timeout, see the Troubleshooting Spread Token Timeout and Unhealthy Node section in this document.
Unhealthy Node
To decrease the impact of an unhealthy node in your Vertica database, Vertica performs regular health checks. The health checks are performed on a regular schedule. The time between each check is set by the user using the DatabaseHeartBeatInterval parameter. This parameter specifies the time intervals between internal health checks performed by each node. After a successful health check, the node sends a heartbeat. If a heartbeat is not detected after 5 intervals have elapsed, then the node is evicted from the database cluster.
For more information about the cause of the timeout, see the Troubleshooting Spread Token Timeout and Unhealthy Node section in this document.
Vertica Process Crashed or Killed Abruptly Using kill-9
Vertica process creates a PROBE message for the Spread daemon. However, if the Vertica process crashes or is terminated abruptly using kill-9, that Vertica process cannot send a PROBE message to the other nodes or call the Spread API, SP_disconnect.
If the Spread daemon for the killed Vertica process is still running, the Spread daemon receives a message about that killed Vertica process through the TCP socket connection. Then, the Spread daemon notifies the other nodes in the cluster that the Vertica process has left the current membership.
Database is DOWN
If the node goes down, the Spread daemons on other nodes detect the down Spread daemon through a token timeout. Suppose you have an 8-node cluster with a K-safety value of 1. If 4 nodes go down or 2 buddy nodes go down, the database goes down. When the node goes down and the database can still continue to operate, the Vertica process invokes the membership protocol to enable the remaining Spread daemons to create a new membership.
Troubleshooting Spread Token Timeout and Unhealthy Node
Spread Token Timeout and Unhealthy Node have several scenarios. Run the following script as a dbadmin user to collect information from the cluster and consider the possibility of each scenario.
$ ./collect_for_spread.sh [-U username] [-w password] [-p port] [-f output_format] [-z dbhost] -s start_time -e end_time
Arguments description:
-U Use database administrator account for username.
-w Database administrator account password in single quotes. Can be skipped in case no password is set.
-p Database server port. Can be skipped if database is running on default port 5433.
-f Specifies output mode. Can be stdout or file. Default is stdout.
-s Specifies start time in single quotes. Format is YYYY-MM-DD HH24:MI:SS.
-e Specifies start time in single quotes. Format is YYYY-MM-DD HH24:MI:SS.
-z is optional if dbhost is needed for connecting to Vertica.
-
Spring Ring Size
There are timeouts when passing a token and creating a membership as the number of Spread daemons becomes large. Spread broadcasts every message (using UDP) to every other daemon in the configuration resulting in increased network congestion.. If you have more than 50 nodes, you must move to a Large Cluster mode.
For more information about how to configure a Large Cluster mode, see Large Cluster in the Vertica Administrator's Guide .
-
Network Bandwidth Starvation
High network usage delays communication between the nodes.
-
Check the network usage of your system by querying the DC_NETWORK_INFO system table. The script run earlier also collects the following network usage information.
=======================================================
b. Network Bandwidth Starvation
=======================================================
b-1. Network usage from DC_NETWORK_INFO
=======================================================
node_name | start_time | end_time | tx_kbytes_per_sec | rx_kbytes_per_sec | total_kbytes_per_sec
------------------+---------------------+---------------------+-------------------+-------------------+----------------------
v_trial_node0001 | 2020-08-04 04:44:59 | 2020-08-04 04:45:00 | 44035.44 | 11274.09 | 55309.53
v_trial_node0002 | 2020-08-04 04:44:59 | 2020-08-04 04:45:00 | 13098.37 | 22710.12 | 35808.49
v_trial_node0003 | 2020-08-04 04:44:59 | 2020-08-04 04:45:00 | 3116.41 | 24514.25 | 27630.66
v_trial_node0004 | 2020-08-04 04:44:59 | 2020-08-04 04:45:00 | 5334.8 | 23950.17 | 29284.97
v_trial_node0001 | 2020-08-04 04:45:00 | 2020-08-04 04:45:01 | 17377.85 | 28435.98 | 45813.83
v_trial_node0002 | 2020-08-04 04:45:00 | 2020-08-04 04:45:01 | 17255.69 | 25164.83 | 42420.52
v_trial_node0003 | 2020-08-04 04:45:00 | 2020-08-04 04:45:01 | 46322.48 | 19192.34 | 65514.82
v_trial_node0004 | 2020-08-04 04:45:00 | 2020-08-04 04:45:01 | 9300.44 | 31563 | 40863.44
.....
-
Measure the network performance of your host using vnetperf. Compare the megabytes sent and megabytes received with the available bandwidth using vnetperf. The script run earlier also collects the result of vnetperf. In the following example, the available bandwidth is about 600 MB (4.6 Gbps).
=======================================================
b-2. Network performance from vnetperf
=======================================================
date | test | rate limit (MB/s) | node | MB/s (sent) | MB/s (rec)
-----------------------------------------------------------------------------------------------------
2020-08-04_05:38:35,962 | tcp-throughput | 32 | average | 30.6099 | 30.6099
2020-08-04_05:38:37,968 | tcp-throughput | 64 | average | 61.1261 | 61.1261
2020-08-04_05:38:39,972 | tcp-throughput | 128 | average | 122.137 | 122.137
2020-08-04_05:38:41,977 | tcp-throughput | 256 | average | 244.212 | 244.212
2020-08-04_05:38:43,980 | tcp-throughput | 512 | average | 488.345 | 488.345
2020-08-04_05:38:45,984 | tcp-throughput | 640 | average | 588.28 | 588.204
2020-08-04_05:38:47,988 | tcp-throughput | 768 | average | 663.714 | 663.59
2020-08-04_05:38:49,994 | tcp-throughput | 1024 | average | 779.429 | 778.769
2020-08-04_05:38:52,83 | tcp-throughput | 2048 | average | 688.616 | 688.431
-
Use Database Designer to tune your queries or tune manually. Unoptimized projections may cause high network usage due to the RESEGMENT/BROADCAST operators.
-
If you continue to see high network usage, upgrade your network. If CPU usage is not high, you may be able to compress network data by enabling the CompressNetworkData configuration parameter. For example:
=> ALTER DATABASE DEFAULT SET CompressNetworkData = 1;
-
-
Disk I/O Bandwidth Starvation
If the Vertica database has large RAM and large memory then the default memory is used for write-caching which results in a full flush. Full flush blocks the Spread daemons for a long time triggering token timeouts.
If the disks are unable to keep up with the incoming write requests, the system writes data to disks from the application. This results in the write cache to grow beyond a threshold. The kernel blocks all the IO requests until the cache is flushed below the defined threshold. Sometimes, under high load this leads to the node exiting the cluster.
vm.dirty_background_ratio = 3
vm.dirty_ratio = 5
The first parameter vm.dirty_background ratio defines the threshold of write-cache usage. Upon reaching the threshold, the kernel performs a background flush to disk.
The second parameter vm.dirty_ratio defines the threshold of memory. If the threshold becomes dirty, the kernel begins to block other IO requests until a flush completes.
For more information about how to tune these thresholds, See Tuning Linux Dirty Data Parameters for Vertica.
You can check Disk I/O usage with the following steps.
-
Check the Disk I/O usage of your system by querying the DC_IO_INFO system table. The script run earlier also collects the following disk I/O usage information.
=======================================================
c. Disk I/O Bandwidth Starvation
=======================================================
c-1. Disk I/O usage from DC_IO_INFO
=======================================================
node_name | device_name | start_time | end_time | read_mbytes_per_sec | written_mbytes_per_sec | total_mbytes_per_sec
------------------+-------------+---------------------+---------------------+---------------------+------------------------+----------------------
v_trial_node0001 | sda3 | 2020-08-05 06:12:50 | 2020-08-05 06:12:51 | 78.43 | 272.11 | 350.54
v_trial_node0002 | sda3 | 2020-08-05 06:12:50 | 2020-08-05 06:12:51 | 89 | 22.5 | 111.5
v_trial_node0003 | sda3 | 2020-08-05 06:12:50 | 2020-08-05 06:12:51 | 9.92 | 72.07 | 81.99
v_trial_node0004 | sda3 | 2020-08-05 06:12:50 | 2020-08-05 06:12:51 | 12.07 | 50.4 | 62.47
v_trial_node0001 | sda3 | 2020-08-05 06:12:51 | 2020-08-05 06:12:52 | 95.6 | 188.33 | 283.93
v_trial_node0002 | sda3 | 2020-08-05 06:12:51 | 2020-08-05 06:12:52 | 76 | 196.23 | 272.23
v_trial_node0003 | sda3 | 2020-08-05 06:12:51 | 2020-08-05 06:12:52 | 5.98 | 107.47 | 113.45
v_trial_node0004 | sda3 | 2020-08-05 06:12:51 | 2020-08-05 06:12:52 | 19.91 | 133 | 152.91
v_trial_node0001 | sda3 | 2020-08-05 06:12:52 | 2020-08-05 06:12:53 | 88.32 | 86.67 | 174.99
v_trial_node0002 | sda3 | 2020-08-05 06:12:52 | 2020-08-05 06:12:53 | 78.01 | 195.02 | 273.03
v_trial_node0003 | sda3 | 2020-08-05 06:12:52 | 2020-08-05 06:12:53 | 2 | 92.27 | 94.27
v_trial_node0004 | sda3 | 2020-08-05 06:12:52 | 2020-08-05 06:12:53 | 19 | 71.5 | 90.5
v_trial_node0001 | sda3 | 2020-08-05 06:12:53 | 2020-08-05 06:12:54 | 97.5 | 164.29 | 261.79
v_trial_node0002 | sda3 | 2020-08-05 06:12:53 | 2020-08-05 06:12:54 | 72.5 | 213.17 | 285.67
v_trial_node0003 | sda3 | 2020-08-05 06:12:53 | 2020-08-05 06:12:54 | 0 | 93.29 | 93.29
v_trial_node0004 | sda3 | 2020-08-05 06:12:53 | 2020-08-05 06:12:54 | 18.85 | 76.27 | 95.12
.....
-
Measure the Disk I/O performance of your host using vioperf. Compare the megabytes read and megabytes write with the available bandwidth using vioperf. The script run earlier also collects the result of vioperf. In the following example, the available bandwidth is about 340 MB/s for Write, 250 MB/s for Read, 200 MB/s for Read-Write.
=======================================================
c-2. Disk I/O performance from vioperf
=======================================================
test | directory | counter name | counter value | thread count | %CPU | %IO Wait
---------------------------s--------------------------------------------------------------------------------------------------------
Write | ...badmin/trial/v_trial_node0001_catalog/Catalog| MB/s | 340 | 4 | 28 | 49
ReWrite | ...badmin/trial/v_trial_node0001_catalog/Catalog| (MB-read+MB-write)/s| 100+100 | 4 | 7 | 46
Read | ...badmin/trial/v_trial_node0001_catalog/Catalog| MB/s | 250 | 4 | 17 | 45
SkipRead | ...badmin/trial/v_trial_node0001_catalog/Catalog| seeks/s | 3199 | 4 | 2 | 38
-
Tune Linux Dirty Page parameters as described earlier. Use Database Designer to tune your queries or tune manually. Unoptimized projections may cause high disk I/O usage due to the unoptimized encoding type.
-
-
Network UDP Receive Error and TCP Retransmitted
If you see a large number of UDP packet receive errors or TCP retransmitted segments, you may need to tune the kernel parameters as follows.
-
Check the number of UDP network packet receive errors and TCP retransmitted segments by querying DC_NETSTATS system table. The script run earlier also collects these numbers and ratios.
=======================================================
d. Network UDP Receive Error and TCP Retransmitted
=======================================================
node_name | start_time | end_time | upd_packet_receive_errors | udp_packets_received | upd_packet_receive_error_ratio | tcp_segments_retransmited | tcp_segments_received | tcp_segments_retrans_ratio
------------------+---------------------+---------------------+---------------------------+----------------------+--------------------------------+---------------------------+-----------------------+----------------------------
v_trial_node0001 | 2020-08-04 05:05:33 | 2020-08-04 05:05:34 | 0 | 63 | 0 | 0 | 26233 | 0
v_trial_node0002 | 2020-08-04 05:05:33 | 2020-08-04 05:05:34 | 0 | 30 | 0 | 0 | 12317 | 0
v_trial_node0003 | 2020-08-04 05:05:33 | 2020-08-04 05:05:34 | 0 | 260 | 0 | 0 | 23149 | 0
v_trial_node0004 | 2020-08-04 05:05:33 | 2020-08-04 05:05:34 | 0 | 260 | 0 | 0 | 21644 | 0
v_trial_node0001 | 2020-08-04 05:05:34 | 2020-08-04 05:05:35 | 0 | 0 | 0 | 0 | 39041 | 0
v_trial_node0002 | 2020-08-04 05:05:34 | 2020-08-04 05:05:35 | 0 | 234 | 0 | 0 | 35312 | 0
v_trial_node0003 | 2020-08-04 05:05:34 | 2020-08-04 05:05:35 | 0 | 0 | 0 | 0 | 38657 | 0
v_trial_node0004 | 2020-08-04 05:05:34 | 2020-08-04 05:05:35 | 0 | 0 | 0 | 0 | 35711 | 0
.....
-
If you see a large number of UDP packet receive errors or TCP retransmitted segments, add the following parameters to the
/etc/sysctl.conffile.# Sets the number of incoming connections
net.core.somaxconn = 1024
net.ipv4.tcp_max_syn_backlog = 1024
# Sets the send socket buffer default size in bytes.
net.core.wmem_default = 262144
# Sets the receive socket buffer default size in bytes.
net.core.rmem_default = 262144
# Sets the send socket buffer maximum size in bytes.
net.core.wmem_max = 16777216
# Sets the receive socket buffer maximum size in bytes.
# If you see UDP packet errors with the following number, you can increase this value by 33554432.
net.core.rmem_max = 16777216
# Sets the maximum number of packets allowed to queue when a particular interface receives packets faster than the kernel can process them.
# Increase the length of the processor input queue
net.core.netdev_max_backlog = 100000
# Sets the minimum, pressure, maximum number of memory pages used by TCP socket.
net.ipv4.tcp_mem = 16777216 16777216 16777216
# Sets the TCP socket buffer minimum, default, maximum size in bytes.
net.ipv4.tcp_wmem = 8192 262144 8388608
net.ipv4.tcp_rmem = 8192 262144 8388608
# Sets the minimum, pressure, maximum number of memory pages used by UDP socket.
net.ipv4.udp_mem = 16777216 16777216 16777216
# Sets the UDP socket buffer minimum size in bytes.
net.ipv4.udp_rmem_min = 16384
net.ipv4.udp_wmem_min = 16384
After adding parameters to the
/etc/sysctl.conffile, run the following command:$ sysctl -pIf you continue to see a large number of UDP packet receive errors or TCP retransmitted segments, you may need to turn off the TCP offload features on the network interface cards.
-
Check the current configuration for the TCP offload features by using the following command. 'eth0' is the device name of the network interface card. Specify the device name of the network interface card which is used by Spread communication.
$ /sbin/ethtool -k eth0
Features for eth0:
rx-checksumming: on
tx-checksumming: on
tx-checksum-ipv4: off
tx-checksum-unneeded: off
tx-checksum-ip-generic: on
tx-checksum-ipv6: off
tx-checksum-fcoe-crc: off [fixed]
tx-checksum-sctp: off [fixed]
scatter-gather: on
tx-scatter-gather: on
tx-scatter-gather-fraglist: off [fixed]
tcp-segmentation-offload: on
tx-tcp-segmentation: on
tx-tcp-ecn-segmentation: off
tx-tcp6-segmentation: on
udp-fragmentation-offload: off [fixed]
generic-segmentation-offload: on
generic-receive-offload: on
large-receive-offload: on
rx-vlan-offload: on
tx-vlan-offload: on
ntuple-filters: off
receive-hashing: on
highdma: on [fixed]
rx-vlan-filter: on [fixed]
vlan-challenged: off [fixed]
tx-lockless: off [fixed]
netns-local: off [fixed]
tx-gso-robust: off [fixed]
tx-fcoe-segmentation: off [fixed]
tx-gre-segmentation: off [fixed]
tx-udp_tnl-segmentation: off [fixed]
fcoe-mtu: off [fixed]
loopback: off [fixed]
-
Turn off the TCP offload features by using the following command. For example:
$ /sbin/ethtool -K eth0 sg off tso off gso off gro off lro off rx off tx off
-
-
Memory Starvation
High memory usage makes Spread swap to the disk which cases delay in communication between the nodes.
-
Check the memory usage of your system by querying the DC_MEMORY_INFO system table. The script run earlier also collects the following memory usage information.
=======================================================
e. Memory Starvation
=======================================================
e-1. Memory usage from DC_MEMORY_INFO
=======================================================
node_name | start_time | end_time | average_memory_usage_percent
------------------+---------------------+---------------------+------------------------------
v_trial_node0001 | 2020-08-04 05:08:59 | 2020-08-04 05:09:00 | 43.53
v_trial_node0002 | 2020-08-04 05:08:59 | 2020-08-04 05:09:00 | 42.23
v_trial_node0003 | 2020-08-04 05:08:59 | 2020-08-04 05:09:00 | 42.42
v_trial_node0004 | 2020-08-04 05:08:59 | 2020-08-04 05:09:00 | 42.1
v_trial_node0001 | 2020-08-04 05:09:00 | 2020-08-04 05:09:01 | 43.59
v_trial_node0002 | 2020-08-04 05:09:00 | 2020-08-04 05:09:01 | 42.23
v_trial_node0003 | 2020-08-04 05:09:00 | 2020-08-04 05:09:01 | 42.48
v_trial_node0004 | 2020-08-04 05:09:00 | 2020-08-04 05:09:01 | 42.12
.....
-
Check the size of the catalog by querying the DC_ALLOCATION_POOL_STATISTICS system table. The script run earlier also collects the following catalog size information.
=======================================================
e-2. Catalog size
=======================================================
node_name | ts | catalog_size_in_mb
------------------+---------------------+------------------------------------------
v_trial_node0001 | 2020-08-04 05:45:14 | 105.914031982421875000000000000000000000
v_trial_node0002 | 2020-08-04 05:44:57 | 134.056930541992187500000000000000000000
v_trial_node0003 | 2020-08-04 05:45:14 | 133.696777343750000000000000000000000000
v_trial_node0004 | 2020-08-04 05:45:14 | 134.865783691406250000000000000000000000
-
If the catalog size is larger than 4% of total memory size, reduce the general resource pool memory usage, and restart the cluster.
For example, if the catalog size is 5 GB and the physical memory size is 100 GB, 95% memory size is 95 GB. The catalog information is loaded outside of the Vertica memory space. Hence, you need to reduce the MAXMEMORYSIZE of the general resource pool.
To reduce the MAXMEMORYSIZE of the general resource pool, use the following command:
=> SELECT name, maxmemorysize FROM v_catalog.resource_pools WHERE name = 'general';
name | maxmemorysize
---------+---------------
general | Special: 95%
=> ALTER RESOURCE POOL general maxmemorysize '90%';
NOTICE 2585: Change takes effect upon restart. Recovering nodes will use the new value
=> SELECT name, maxmemorysize FROM v_catalog.resource_pools WHERE name = 'general';
name | maxmemorysize
---------+---------------
general | Special: 90%
Another alternative is to create a new dedicated resource pool for the catalog. Do not use it by any query.
To create a dedicated resource pool, use the following command:
=> CREATE RESOURCE POOL catalog_pool memorysize '5G'; -
Another option to reduce the allocation memory by Vertica process is tuning glibc memory allocation. Please refer to the following page for the detailed steps to tune it.
-
-
CPU Bound
High CPU usage causes delay in communication between the nodes.
-
Check the CPU usage of your system by querying the DC_CPU_AGGREGATE system table. The script run earlier also collects the following CPU usage information.
=======================================================
f. CPU Bound
=======================================================
node_name | processor_id | start_time | end_time | average_cpu_usage_percent
------------------+--------------+---------------------+---------------------+---------------------------
v_trial_node0001 | aggregate | 2020-08-04 04:30:29 | 2020-08-04 04:30:30 | 83.8400000000000000000
v_trial_node0002 | aggregate | 2020-08-04 04:30:29 | 2020-08-04 04:30:30 | 100.0000000000000000000
v_trial_node0003 | aggregate | 2020-08-04 04:30:29 | 2020-08-04 04:30:30 | 100.0000000000000000000
v_trial_node0004 | aggregate | 2020-08-04 04:30:29 | 2020-08-04 04:30:30 | 99.7500000000000000000
v_trial_node0001 | aggregate | 2020-08-04 04:30:30 | 2020-08-04 04:30:31 | 61.1700000000000000000
v_trial_node0002 | aggregate | 2020-08-04 04:30:30 | 2020-08-04 04:30:31 | 99.7500000000000000000
v_trial_node0003 | aggregate | 2020-08-04 04:30:30 | 2020-08-04 04:30:31 | 100.0000000000000000000
v_trial_node0004 | aggregate | 2020-08-04 04:30:30 | 2020-08-04 04:30:31 | 100.0000000000000000000
.....
-
If the CPU usage is very high, assign a single core to spread.
To check the number of CPU cores, use the following command:
$ grep processor /proc/cpuinfo
processor : 0
processor : 1
processor : 2
processor : 3
Prepare 2 configuration files with the following contents. Specify all CPU cores to cpuset.cpus value for CPU_Vertica_Group except a single core assigned to spread.
/etc/cgconfig.confgroup CPU_Vertica_Group {cpuset {cpuset.mems="0";
cpuset.cpus="0-2";
}
}
group CPU_Spread_Group {cpuset {cpuset.mems="0";
cpuset.cpus="3";
}
}
/etc/cgrules.confdbadmin:/opt/vertica/bin/vertica cpuset CPU_Vertica_Group
dbadmin:/opt/vertica/spread/sbin/spread cpuset CPU_Spread_Group
Install cgroup (Control Group) package on all nodes and start up the associated services.
For example, in the case of RHEL/CentOS 6:
$ yum install libcgroup
$ chkconfig cgconfig on
$ chkconfig cgred on
$ service cgconfig start
$ service cgred start
In the case of RHEL/CentOS 7:
$ yum install libcgroup libcgroup-tools
$ systemctl start cgconfig
$ systemctl start cgred
$ systemctl enable cgconfig
$ systemctl enable cgred
In the case of RHEL/CentOS 8:
$ dnf install gcc byacc flex pam-devel redhat-lsb-core

$ wget https://github.com/libcgroup/libcgroup/releases/download/v2.0/libcgroup-2.0.tar.gz
$ tar zxvf libcgroup-2.0.tar.gz
$ cd libcgroup-2.0/
$ ./configure --enable-initscript-install
$ make
$ make install


$ mkdir /etc/cgconfig.d

$ cp /usr/local/etc/rc.d/init.d/cgconfig /etc/rc.d/init.d/
$ cp /usr/local/etc/rc.d/init.d/cgred /etc/rc.d/init.d/
Note During execution of the configure command, the following error occurs in libcgroup-2.0 and 2.0.1. If configure command finishes successfully, it can ignore this error.
libcgroup-2.0
$ ./configure --enable-initscript-install
.....
checking whether to build static libraries... yes
./configure: line 12526: with_bindings: command not found
checking for g++... g++
libcgroup-2.0.1
$ ./configure --enable-initscript-install
.....
checking whether to build static libraries... yes
./configure: line 12510: with_bindings: command not found
checking for g++... g++
If you don't want to ignore it, add
--enable-bindingsoption.$ ./configure --enable-initscript-install --enable-bindings
This option enables the python bindings feature. It may not have any impact.
Additionally, in the case of RHEL/CentOS 8, modify the following files:
[/etc/rc.d/init.d/cgred]
# Should-Start:     --(modify to)--> # Default-Start:      2 3 4 5
# Should-Stop:      --(modify to)--> # Default-Stop:       0 1 6

[/etc/rc.d/init.d/cgconfig]
# Should-Start:     --(modify to)--> # Default-Start:      2 3 4 5
# Should-Stop:      --(modify to)--> # Default-Stop:       0 1 6
Then, start up the services by the running following commands:
$ systemctl enable cgconfig.service
$ systemctl start cgconfig.service
$ systemctl enable cgred.service
$ systemctl start cgred.service
In the case of Ubuntu 16.04 LTS:
$ apt install cgroup-bin cgroup-lite cgroup-tools cgroupfs-mount libcgroup1
$ cp /usr/share/doc/cgroup-tools/examples/cgred.conf /etc/
$ cp /usr/share/doc/cgroup-tools/examples/cgsnapshot_blacklist.conf /etc/
$ cp /usr/share/doc/cgroup-tools/examples/cgconfig /etc/init.d/
$ cp /usr/share/doc/cgroup-tools/examples/cgred /etc/init.d/
$ chmod 755 /etc/init.d/cgconfig
$ chmod 755 /etc/init.d/cgred
In addition, in the cause of Ubuntu 16.04 LTS, modify the following files:
[/etc/init.d/cgred]
# Should-Start: --(modify to)--> # Default-Start: 2 3 4 5
# Should-Stop: --(modify to)--> # Default-Stop: 0 1 6
. /etc/rc.d/init.d/functions (remove this line)
daemon --check $servicename --pidfile $pidfile $CGRED_BIN $OPTIONS --(modify to)--> start_daemon -p $pidfile $CGRED_BIN $OPTIONS
[/etc/init.d/cgconfig]
# Should-Start: --(modify to)--> # Default-Start: 2 3 4 5
# Should-Stop: --(modify to)--> # Default-Stop: 0 1 6
Then, start up the services by the following commands:
$ systemctl start cgroupfs-mount.service
$ systemctl start cgconfig.service
$ systemctl start cgred.service
$ systemctl enable cgroupfs-mount.service
$ systemctl enable cgconfig.service
$ systemctl enable cgred.service
Restart the cluster.
-
Spread Logging
If you still hit the Spread issue, you need to enable Spread Logging and see if any messages appear to understand the potential cause.
To enable Spread Logging, run the following queries:
=> SELECT set_spread_options('/opt/vertica/log/spread.log', 'MEMBERSHIP PRINT CONFIGURATION GROUPS SESSION PROTOCOL EXIT', 'ExitOnIdle = yes');=> SELECT reload_spread(true);
The first argument of set_spread_options is the log file name. Note that the size of this log file increases immediately and could cause performance degradation.
The second argument is the list of the debug flags. The available debug flags are as below.
| Flag | Function |
| General info that should always be printed. | |
| EXIT | Errors or other events that cause Spread to quit. |
| DEBUG | Debugging information. |
| DATA_LINK | Lowest level of sending and receiving datagrams. |
| NETWORK | Packing messages and setting who to talk with. |
| PROTOCOL | Ordering, Token handling, and delivery algorithms. |
| SESSION | Per user connection management. |
| CONFIGURATION | Parsing and loading configuration file. |
| MEMBERSHIP | State and messages sent during membership changes. |
| FLOW_CONTROL | Flow control state of the ring. |
| STATUS | Reporting of status information to the monitor. |
| EVENTS | All events (timed, fd based) and main loop. |
| GROUPS | Group state and group membership changes. |
| MEMORY | Memory debugging and allocation. |
| SKIPLIST | State of data structure. |
| ALL | Enables all flags. |
| NONE | Disables all flags. |
The third argument is the extra configuration. Do not change it.
To disable Spread Logging, run the following queries:
=> SELECT set_spread_options('/dev/null', 'PRINT EXIT', 'ExitOnIdle = yes');=> SELECT reload_spread(true);
Sample Message
In this section, the following 3-node cluster is used as the sample:
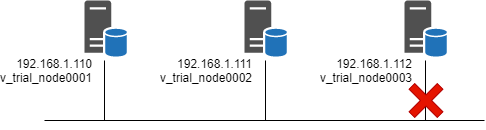
When node 3 is disconnected from the network, you can see the following messages in the vertica.log file on each node.
vertica.log on node#1 and node#2
Spread Service InOrder Queue:0x7fb7f05bc700 [Comms] <INFO> NETWORK change with 1 VS sets
Spread Service InOrder Queue:0x7fb7f05bc700 [Comms] <INFO> VS set #0 (mine) has 2 members (offset=24)
Spread Service InOrder Queue:0x7fb7f05bc700 [Comms] <INFO> VS set #0, member 0: #node_a#N192168001110
Spread Service InOrder Queue:0x7fb7f05bc700 [Comms] <INFO> VS set #0, member 1: #node_b#N192168001111
Spread Service InOrder Queue:0x7fb7f05bc700 [Comms] <INFO> DB Group changed
vertica.log on node#3
Poll dispatch:0x7fcc6cd23700 [Comms] <WARNING> Failed to send spmonitor request: Network is unreachable
Spread Mailbox Dequeue:0x7fcc167fd700 [Comms] <WARNING> error SP_receive: Connection closed by spread
Spread Mailbox Dequeue:0x7fcc167fd700 [Comms] <WARNING> error SP_receive: The network socket experienced an error. This Spread mailbox will no longer work until the connection is disconnected and then reconnected
Spread Mailbox Dequeue:0x7fcc167fd700 [Comms] <INFO> stop: disconnecting #node_c#N192168001112 from spread daemon, Mbox=9
Spread Mailbox Dequeue:0x7fcc167fd700 [Comms] <INFO> connected: false
Spread Mailbox Dequeue:0x7fcc167fd700 [Comms] <INFO> DB Group changed
Spread Mailbox Dequeue:0x7fcc167fd700 [Comms] <INFO> Change in vDBgroupState clerk: was #node_a#N192168001110, now [none] (not me)
Spread Mailbox Dequeue:0x7fcc167fd700 [VMPI] <INFO> DistCall: Set current group members called with 0 members
Spread Mailbox Dequeue:0x7fcc167fd700 [VMPI] <INFO> Ending session v_trial_node0001-18304:0x3d due to loss of 45035996273704978
Spread Mailbox Dequeue:0x7fcc167fd700 [Comms] <INFO> nodeSetNotifier: node v_trial_node0001 left the cluster
Spread Mailbox Dequeue:0x7fcc167fd700 [Recover] <INFO> Running hooks after detecting a node loss
Spread Mailbox Dequeue:0x7fcc167fd700 [Session] <INFO> Resetting load balance cache. Internal version reset? [no]
Spread Mailbox Dequeue:0x7fcc167fd700 [Session] <INFO> Invalidating Load Balance Cache. Resetting internal version? no
Spread Mailbox Dequeue:0x7fcc167fd700 [Recover] <INFO> Node left cluster, reassessing k-safety...
Spread Mailbox Dequeue:0x7fcc167fd700 [Recover] <INFO> Setting node v_trial_node0003 to UNSAFE
Spread Mailbox Dequeue:0x7fcc167fd700 [Comms] <INFO> Node v_trial_node0001 erased from nodeToState map
Spread Mailbox Dequeue:0x7fcc167fd700 <LOG> @v_trial_node0003: 00000/3298: Event Posted: Event Code:6 Event Id:5 Event Severity: Informational [6] PostedTimestamp: 2020-08-31 10:41:47.188686 ExpirationTimestamp: 2088-09-18 13:55:54.188686 EventCodeDescription: Node State Change ProblemDescription: Changing node v_trial_node0003 startup state to UNSAFE DatabaseName: trial Hostname: vertica03c8.corp.vertica.local
Spread Mailbox Dequeue:0x7fcc167fd700 <LOG> @v_trial_node0003: 00000/3293: Event Cleared: Event Code:6 Event Id:6 Event Severity: Informational [6] PostedTimestamp: 2020-08-31 10:41:47.188734 ExpirationTimestamp: 2020-08-31 10:41:47.188734 EventCodeDescription: Node State Change ProblemDescription: Changing node v_trial_node0003 leaving startup state UP DatabaseName: trial Hostname: vertica03c8.corp.vertica.local
Spread Mailbox Dequeue:0x7fcc167fd700 [Recover] <INFO> Changing node v_trial_node0003 startup state from UP to UNSAFE
Spread Mailbox Dequeue:0x7fcc167fd700 <LOG> @v_trial_node0003: 00000/3298: Event Posted: Event Code:2 Event Id:0 Event Severity: Emergency [0] PostedTimestamp: 2020-08-31 10:41:47.188765 ExpirationTimestamp: 2020-08-31 10:51:47.188765 EventCodeDescription: Loss Of K Safety ProblemDescription: System is not K-safe: K=1 total number of nodes=3 DatabaseName: trial Hostname: vertica03c8.corp.vertica.local
Spread Mailbox Dequeue:0x7fcc167fd700 [Comms] <INFO> nodeSetNotifier: node v_trial_node0002 left the cluster
Spread Mailbox Dequeue:0x7fcc167fd700 [Recover] <INFO> Running hooks after detecting a node loss
Spread Mailbox Dequeue:0x7fcc167fd700 [Session] <INFO> Resetting load balance cache. Internal version reset? [no]
Spread Mailbox Dequeue:0x7fcc167fd700 [Session] <INFO> Invalidating Load Balance Cache. Resetting internal version? no
Spread Mailbox Dequeue:0x7fcc167fd700 [Recover] <INFO> Node left cluster, reassessing k-safety...
Spread Mailbox Dequeue:0x7fcc167fd700 [Comms] <INFO> Node v_trial_node0002 erased from nodeToState map
Spread Mailbox Dequeue:0x7fcc167fd700 [Comms] <INFO> nodeSetNotifier: node v_trial_node0003 left the cluster
Spread Mailbox Dequeue:0x7fcc167fd700 [Recover] <INFO> Running hooks after detecting a node loss
Spread Mailbox Dequeue:0x7fcc167fd700 [Recover] <INFO> Node left cluster, reassessing k-safety...
Spread Mailbox Dequeue:0x7fcc167fd700 [Comms] <INFO> Node v_trial_node0003 erased from nodeToState map
Spread Mailbox Dequeue:0x7fcc167fd700 [Comms] <INFO> NodeHeartbeatManager: SP_stop_monitoring invoked
Spread Mailbox Dequeue:0x7fcc167fd700 [Comms] <WARNING> NodeHeartbeatManager: SP_stop_monitoring failed with return code -18
Spread Mailbox Dequeue:0x7fcc167fd700 [Comms] <INFO> NodeHeartbeatManager: Notifying the thread waiting on health_check message before disabling HeartbeatGenerator service
Spread Mailbox Dequeue:0x7fcc167fd700 [Comms] <INFO> Lost membership of the DB group
Spread Mailbox Dequeue:0x7fcc167fd700 [Comms] <INFO> Removing #node_a#N192168001110->v_trial_node0001 from processToNode and other maps due to departure from Vertica:all
Spread Mailbox Dequeue:0x7fcc167fd700 [Comms] <INFO> nodeToState map:
Spread Mailbox Dequeue:0x7fcc167fd700 [Comms] <INFO> Removing #node_b#N192168001111->v_trial_node0002 from processToNode and other maps due to departure from Vertica:all
Spread Mailbox Dequeue:0x7fcc167fd700 [Comms] <INFO> nodeToState map:
Spread Mailbox Dequeue:0x7fcc167fd700 [Comms] <INFO> Removing #node_c#N192168001112->v_trial_node0003 from processToNode and other maps due to departure from Vertica:all
Spread Mailbox Dequeue:0x7fcc167fd700 [Comms] <INFO> nodeToState map:
Spread Mailbox Dequeue:0x7fcc167fd700 [Comms] <INFO> Lost membership of V:All
Spread Mailbox Dequeue:0x7fcc167fd700 [Dist] <INFO> TS: cluster (V:all) changed
Spread Mailbox Dequeue:0x7fcc167fd700 [Comms] <WARNING> VSpread disconnected: lost connection to daemon /opt/vertica/spread/tmp/4803
Spread Mailbox Dequeue:0x7fcc167fd700 [Comms] <INFO> Spread dequeue thread exiting
SafetyShutdown:0x7fcbfdfff700 [Shutdown] <INFO> Shutting down this node
In the spread.log file, you can see the following message on each node:
spread.log on node#1
Prot_token_hurry: retransmiting token 6 1
Prot_token_hurry: retransmiting token 6 2
Prot_token_hurry: retransmiting token 6 3
Prot_token_hurry: retransmiting token 6 4
Prot_token_hurry: retransmiting token 6 5
Prot_token_hurry: retransmiting token 6 6
Prot_token_hurry: retransmiting token 6 7
Prot_token_hurry: retransmiting token 6 8
Prot_token_hurry: retransmiting token 6 9
Prot_token_hurry: retransmiting token 6 10
Prot_token_hurry: retransmiting token 6 11
Prot_token_hurry: retransmiting token 6 12
Prot_token_hurry: retransmiting token 6 13
Prot_token_hurry: retransmiting token 6 14
Prot_token_hurry: retransmiting token 6 15
Prot_token_hurry: retransmiting token 6 0
Prot_token_hurry: retransmiting token 6 1
Prot_token_hurry: retransmiting token 6 2
Prot_token_hurry: retransmiting token 6 3
Prot_token_hurry: retransmiting token 6 4
Prot_token_hurry: retransmiting token 6 5
Prot_token_hurry: retransmiting token 6 6
Prot_token_hurry: retransmiting token 6 7
Sess_disable_heartbeats: explict = 1, thresh = 0, heartbeats_on = 1
Sess_disable_heartbeats: disabling heartbeat monitoring on 'node_a' ( mailbox 9 ).
Memb_token_loss: ############### I lost my token, state was 1
Scast_alive: State is 2
Send_join: State is 4
Memb_handle_message: handling join message from 192.168.1.111 (1862379712), State is 4
Sess_read: received a heartbeat on 'node_a' ( mailbox 9 )
Pushed eviction timeout back 600.000000s
Create_form1: putting Aru = 11614 and Highest_Seq = 11614 on rg_info form1 token
Create_form1: SENT following token:
=========== Form Token ==========
FORM 1 Token, sent by 192.168.1.110 (1845602496). Seq: 14947
Configuration hash: 536829647 (local hash 536829647)
ProcID: 192.168.1.110 (1845602496) ARU: 0
ARU LastID: unknown (0)
FlowControl: 0 RTR Len: 45
Form Token members list -- Active (1) Pending (0)
0: 192.168.1.110 (1845602496)
Pending Members:
Form Token reps list -- Count (2) index (1)
0: 192.168.1.110 (1845602496) (T 1 SegInd 0) 1: 192.168.1.111 (1862379712) (T 1 SegInd 1)
Form Token RING list -- Count (1)
Ring 0: MembID 192.168.1.110 (1845602496) - 1598592925 TransTime 0
ARU: 11614 HighSeq: 11614 NumHoles: 0
NumCommit: 1 NumTrans: 1
Message Holes:
Trans List: 0: 192.168.1.110
Commit List:
====================================================
spread.log on node#2
Memb_token_loss: ############### I lost my token, state was 1
Scast_alive: State is 2
Memb_handle_message: handling join message from 192.168.1.110 (1845602496), State is 2
Send_join: State is 4
Memb_handle_message: handling join message from 192.168.1.110 (1845602496), State is 4
Prot_handle_token: it is a Form Token.
Memb_handle_token: handling form1 token
Handle_form1 in GATHER
Fill_form1: RECEIVED following token:
=========== Form Token ==========
FORM 1 Token, sent by 192.168.1.110 (1845602496). Seq: 14947
Configuration hash: 536829647 (local hash 536829647)
ProcID: 192.168.1.110 (1845602496) ARU: 0
ARU LastID: unknown (0)
FlowControl: 0 RTR Len: 45
Form Token members list -- Active (1) Pending (0)
0: 192.168.1.110 (1845602496)
Pending Members:
Form Token reps list -- Count (2) index (1)
0: 192.168.1.110 (1845602496) (T 1 SegInd 0) 1: 192.168.1.111 (1862379712) (T 1 SegInd 1)
Form Token RING list -- Count (1)
Ring 0: MembID 192.168.1.110 (1845602496) - 1598592925 TransTime 0
ARU: 11614 HighSeq: 11614 NumHoles: 0
NumCommit: 1 NumTrans: 1
Message Holes:
Trans List: 0: 192.168.1.110
Commit List:
====================================================
spread.log on node#3
Memb_token_loss: ############### I lost my token, state was 1
Scast_alive: State is 2
Scast_alive: State is 2
Scast_alive: State is 2
Scast_alive: State is 2
Send_join: State is 4
Send_join: State is 4
Send_join: State is 4
Send_join: State is 4
Send_join: State is 4
Send_join: State is 4
Send_join: State is 4
Send_join: State is 4
Send_join: State is 4
Send_join: State is 4
Create_form1: putting Aru = 11614 and Highest_Seq = 11614 on rg_info form1 token
Create_form1: SENT following token:
=========== Form Token ==========
FORM 2 Token, sent by 192.168.1.112 (1879156928). Seq: 14947
Configuration hash: 536829647 (local hash 536829647)
ProcID: 192.168.1.112 (1879156928) ARU: 0
ARU LastID: unknown (0)
FlowControl: 0 RTR Len: 45
Form Token members list -- Active (0) Pending (1)
Pending Members:
0: 192.168.1.112 (1879156928)
Form Token Membership ID unknown (0) : 0
Form Token RING list -- Count (1)
Ring 0: MembID 192.168.1.110 (1845602496) - 1598592925 TransTime 0
ARU: 11614 HighSeq: 11614 NumHoles: 0
NumCommit: 1 NumTrans: 1
Message Holes:
Trans List: 0: 192.168.1.112
Commit List:
====================================================
Sess_disable_heartbeats: explict = 1, thresh = 0, heartbeats_on = 0
Sess_disable_heartbeats: disabling heartbeat monitoring on 'r9112-9' ( mailbox 9 ).
Cannot form trivial self-ring. Network is probably broken.Exit caused by Alarm!
Sess: unlinked domain socket file /opt/vertica/spread/tmp/4803; ret=0
Spread daemon exiting normally!

